April 13, 2010
4/13: Bloomberg Viewed As Best NYC Mayor in Recent History
New York City Mayor Michael Bloomberg has earned a very distinctive honor. A plurality of registered voters citywide — 38% — say Bloomberg has been the best mayor for New York City in three decades. Rudy Giuliani takes second place with 31% reporting he did the most for the city. Ed Koch was famous for asking voters, “How am I doing?” Well, 15% thought Koch did enough to warrant the title of “New York City’s Best Mayor.” David Dinkins, on the other hand, does not fare nearly as well with just 9% saying he did the most for the five boroughs. 7% are unsure.
Click Here for Complete April 13, 2010 NYC Poll Release and Tables
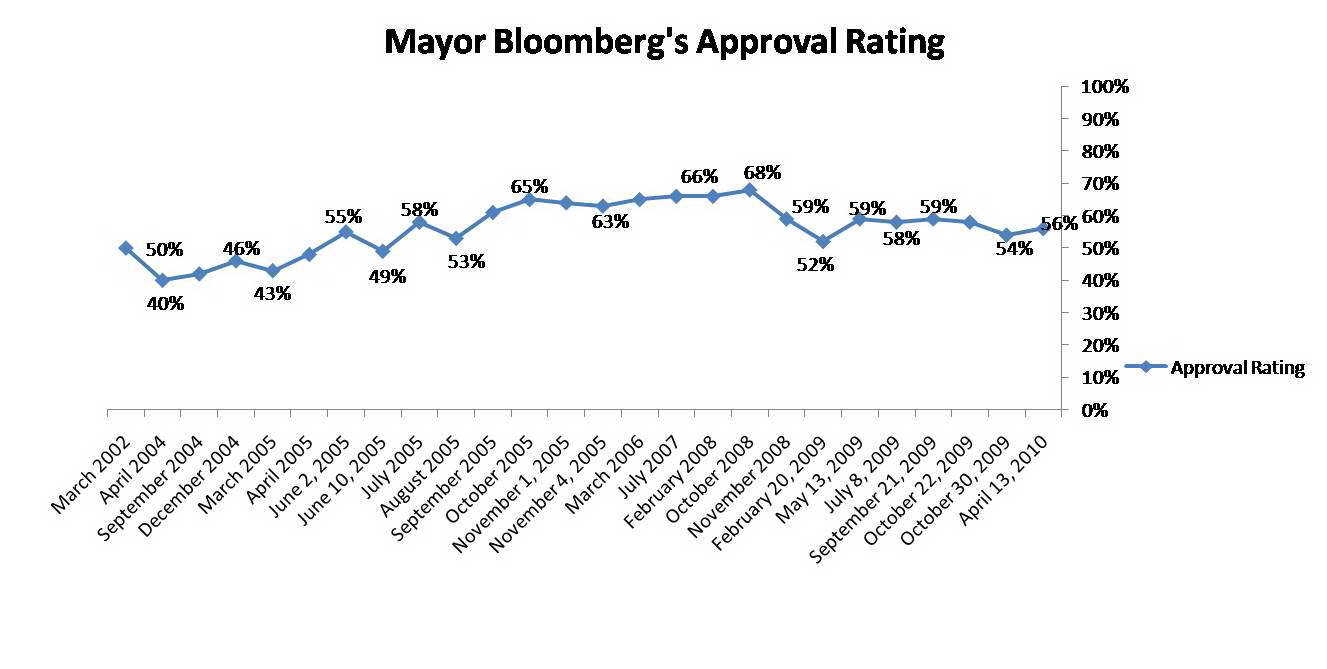
In addition to receiving top honors, a majority — 56% — think Mayor Bloomberg is doing well in office. This includes 13% who say he is doing an excellent job and 43% who report he is doing a good one. 29% believe the mayor is performing fairly well while 13% say he is doing a poor job. When Marist last asked about Mayor Bloomberg’s job performance in its October 30th survey in the heat of his re-election campaign, 54% gave the mayor high marks while one-third graded him as average. 12% said he was performing poorly.
“Mayor Bloomberg has been able to keep his approval rating intact despite governing during difficult economic times. Compared with his predecessors, so is his legacy,” says Dr. Lee M. Miringoff, Director of The Marist College Institute for Public Opinion.
Although Bloomberg has gained some support among Democrats, he has lost the backing of a substantial proportion of Republicans. Looking at the city’s GOP, 55% currently say he is doing either an excellent or good job as mayor while 69% thought that way in late October. Among Democrats, 56% give Bloomberg a thumbs-up while 51% did the same in that previous survey. When it comes to non-enrolled voters citywide, another 56% now believe the mayor is doing an above average job while 55% held that view at the end of October.
Table: NYC’s Best Mayor
Table: Bloomberg Approval Rating
Table: Bloomberg’s Approval Rating Over Time
Status Quo for Bloomberg “Times Three”
Although voters have a positive view of Bloomberg and his job performance, they don’t think he will break new ground during the rest of his tenure in office. 65% of voters believe Mayor Bloomberg’s third term will be about the same as his previous terms in office. 16% anticipate it will be better, and 15% say it will be worse.
At Issue: Quality of Life
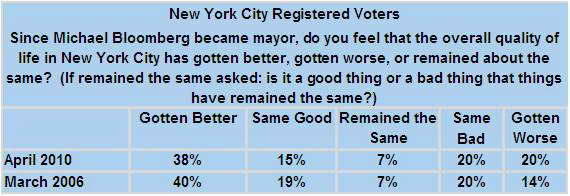
Overall, do New York City voters think Michael Bloomberg is making the quality of life in New York City better or worse since he became mayor? 53% say the quality of life has improved. This includes 38% who report the day-to-day liviEng in the city has gotten better, and 15% who believe the quality of life has changed little, and that’s a good thing. 40% believe the quality of life has declined. This includes one-fifth who think it has gotten worse and an additional 20% who say the quality of life has changed little, and that’s a bad thing. 7% report the quality of life has just remained the same.
Marist last asked this question in March 2006, shortly after Mayor Bloomberg began his second term in office. At that time, 59% said the quality of life improved, including 40% who thought it was better and 19% who reported it was unchanged which was a positive thing. 34% said the day-to-day living in the city deteriorated. This includes 14% who believed the quality of life had gotten worse, and one-fifth who said it was unchanged which was a negative. 7% thought the quality of life remained the same.
Table: Quality of Life Under Bloomberg
Jobs Top List of Mayor’s Priorities
More than a quarter of voters — 27% — think jobs should be the issue Mayor Bloomberg focuses on during his third term. Education follows with 21% while economic development is the concern of 16%. Poverty and security from terrorism each receive 7%. Taxes, housing, and crime are each the top concern for 6% of voters while 3% of the city’s electorate want the mayor to focus on public transportation. Just 1% thinks race relations should be at the center of Bloomberg’s agenda for the next four years.
In Marist’s March 2006 survey, education took the top spot in the eyes of voters followed by security from terrorism, housing, and poverty and homelessness. Jobs and economic development followed along with the other key issues of crime, taxes, and race relations.
Table: Bloomberg’s Priority During Third Term
Economy, Transportation, Schools, and Homelessness Fall in Viewers’ Eyes
Voters are troubled when it comes to the city’s economy, public transportation, schools, and homeless situation. In fact, more voters today compared with four years ago believe the problems in these areas have grown.
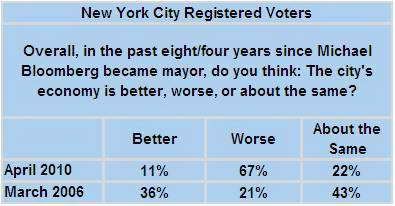
67% of the electorate reports the economy has gotten worse since the mayor took office 8 years ago. 22% say it’s about the same, and just 11% think it’s gotten better.
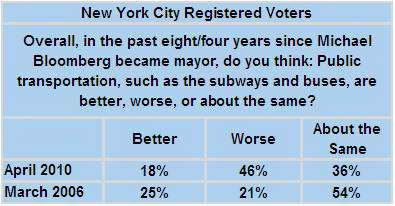
Public transportation is also a bone of contention with voters. 46% believe the quality of the city’s subways and buses have deteriorated while 18% think it has improved. 36% say they are about the same.
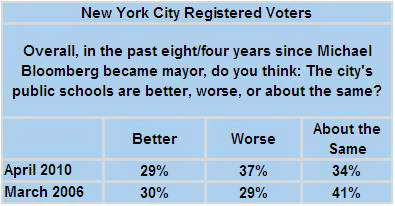
Looking at New York City’s public schools, 37% believe they have gotten worse, 34% say they have remained the same, and 29% report they have gotten better.
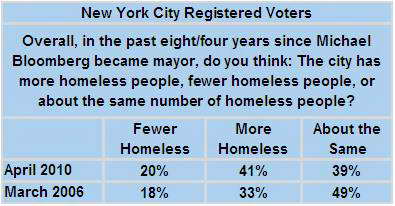
And, the electorate is not satisfied with the city’s homeless situation during the past eight years. 41% believe there are more homeless people in the five boroughs. 39% report there are about the same number, and one-fifth believe there are fewer.
When Marist last gauged public opinion in these areas at the start of the mayor’s second term in March 2006, 21% had a poor view of the economy. And, another 21% had the same impression about public transportation. 29% thought the city’s schools were lacking, and one-third thought there were more homeless people living on the streets.
Table: Status of NYC’s Economy
Table: Status of NYC’s Public Transportation
Table: Status of NYC’s Schools
Table: Status of Homelessness in NYC
Mostly Steady State on Crime, Security from Terrorism, & Race Relations
Since Marist’s March 2006 poll, the city has changed little on crime, security from terrorism, and race relations, according to voters.
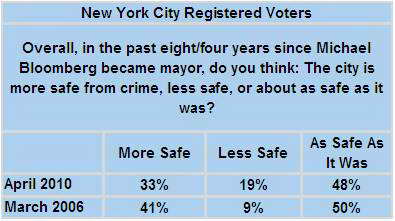
Although fewer voters today think the city is safer from crime compared with four years ago, the proportion of voters who think it has remained the same is little changed. 48% think the city is as safe as it was before Bloomberg took office. 33% say it’s safer, and 19% report it is less safe. Four years ago, the proportion of voters who said their level of safety remained unchanged stood at 50%. At that time, 41% thought it was safer, and 9% believed it was less safe.
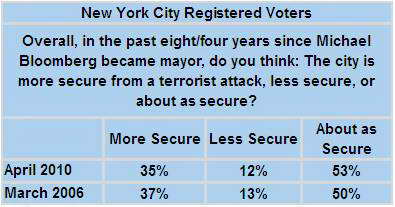
A majority of the electorate believes they are just as safe from a terrorist attack since Bloomberg has been mayor. 53% think this is the case. 35%, however, believe they are more secure, and 12% report they feel less secure. These perceptions are similar to those the Marist Poll found in March 2006.
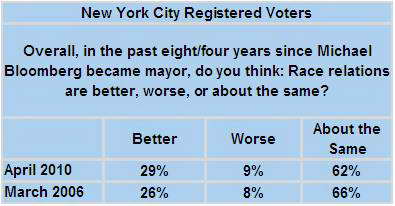
Looking at race relations, more than six in ten members of the electorate — 62% — say race relations in New York City are about the same. 29% think they have gotten better, and 9% report they have gotten worse. Voters’ impressions on this issue are about the same as they were in Marist’s March 2006 survey.
Table: Status of Crime in NYC
Table: Security from Terrorist Attack
Table: Status of NYC’s Race Relations
Sweeping New York City Clean
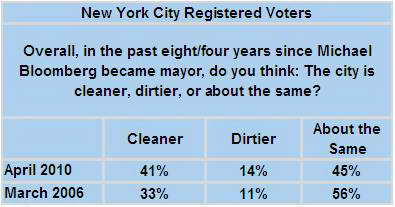
Voters think the city is cleaner. 41% believe this to be the case compared with 14% who say it is dirtier. 45% report it is unchanged during the Bloomberg administration. Compared with four years ago, more voters today think the city is cleaner.
Positive Impressions of City’s Direction Fall to Below 50%
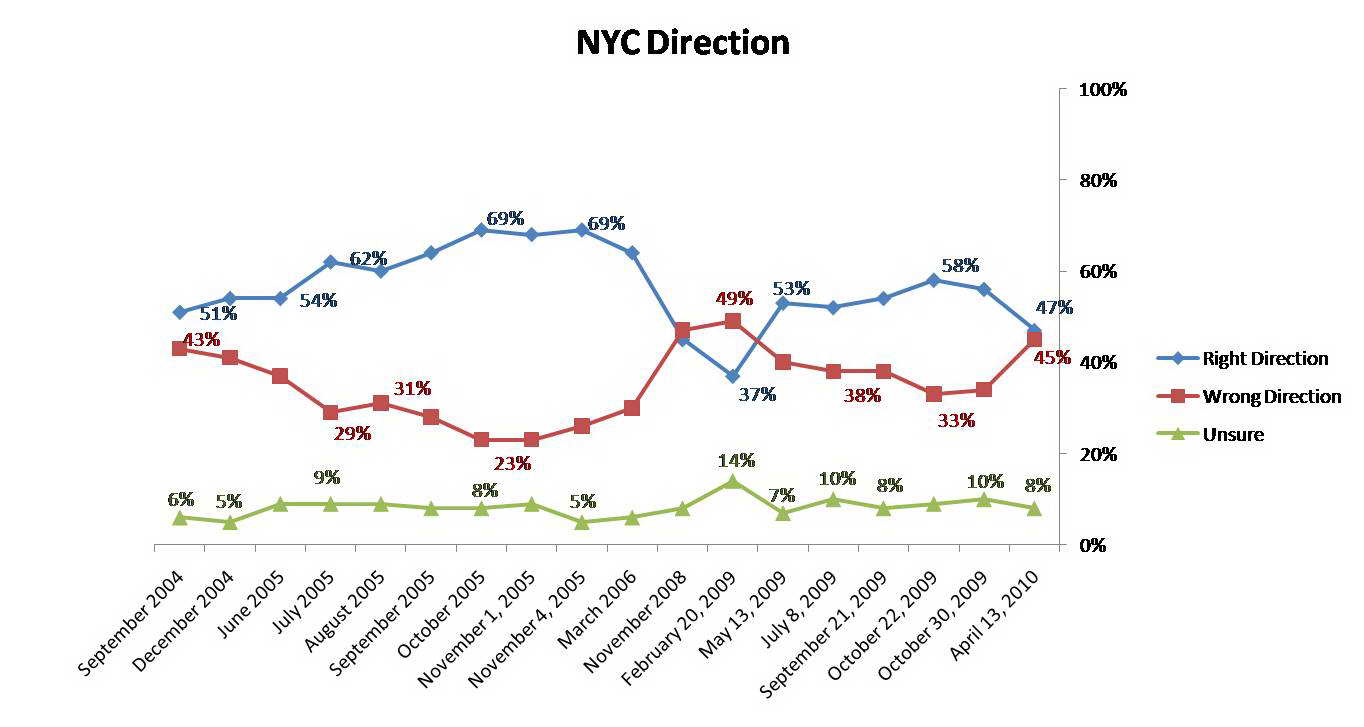
For the first time since February 2009, fewer than half of registered voters in New York City think the city is headed in the right direction. Currently, voters divide with 47% saying the Big Apple is moving in the right direction while 45% report it is travelling in the wrong direction. 8% are unsure. When Marist last asked this question in its October 30th poll, 56% said the city was headed in the right direction, and 34% believed it was moving along the wrong course. 10% were unsure.
The decline has occurred among Republicans and non-enrolled voters. 43% of Republicans and 43% of non-enrolled voters believe the city is on the right track. In Marist’s October 30th survey, those proportions stood at 56% among each of these voting groups.
There has been little movement among Democrats. 51% now report the city is moving in the right direction. 55% held this view at the end of October.
Table: NYC Direction
Table: NYC Direction Over Time
Voters Say, “No,” To Fourth Term, Presidential Run
Although Bloomberg enjoys a comfortable job approval rating, voters do not want him to run for Mayor of New York City in 2013. 67% want Bloomberg to exit gracefully while only 26% want him to seek another 4 years. 7% are unsure.
But, what about President Bloomberg? According to New York City voters, that’s also taboo. More than seven in ten voters — 71% — do not want a 2012 Bloomberg bid for the highest office in the land while just 20% want him to run. 9% are unsure.
When asked in February 2008 if Bloomberg should seek the presidency that year, 66% thought it was a bad idea, 25% wanted him to campaign, and 9% were unsure.
Table: Bloomberg/Fourth Term
Table: 2012 Bloomberg Presidential Candidacy

