handgun leaning on table

Time Machine: Gun Laws in the U.S.

One minute it's a normal day at school, the next it's national news. Americans have seen it happen far too many times. Tragedy strikes and many Americans ask if it could have been prevented. Our ... Read Now >

News

handgun leaning on table

Time Machine: Gun Laws in the U.S.

One minute it’s a normal day at school, the next it’s national news. Americans have seen it happen far too many times. Tragedy strikes and many Americans ask if it could have been prevented. Our relationship with guns is an endless debate. Support for stricter gun laws has shifted over time, with more support following tragedies. Yet…the last major federal law significantly restricting legal access to firearms was passed in 1994!

The National Firearms Act of 1934 was the first major gun law passed in the U.S. It made buying certain weapons, like machine guns, harder in an effort to reduce gang violence. However, firearms in the hands of any civilian can be dangerous. A World War II Veteran in 1949, named Howard Unrah, carried out one of the first mass shootings in the U.S. He killed 13 people using a Luger pistol but, despite the tragedy, there were no major revisions to gun laws until 1968, when the Gun Control Act was passed. The law made it harder for criminals/certain groups to buy guns. Additionally, the government had more control over the sales.

In 1968, when asked how to reduce crime, a Gallup Poll showed that only 1% of U.S. adults felt the need for stricter gun laws. The same poll showed that only 1% named gun control as the most important national problem, while 9% were more concerned about crime.

By the 1970’s, the debate started to grow. A 1976 Gallup Poll found that 35% of U.S adults named gun control as an important voting issue. By the late 1980’s, a majority of Americans supported stronger gun control laws. A Yankelovich/Time Magazine/CNN Poll found that 65% of adults supported stricter gun laws with 28% opposing. However, the opinions of gun owners were different. The same poll found that 63% of gun owners thought that stricter gun laws would not reduce violence with 31% believing they would. The other 6% were unsure.

In 1993, support for stricter gun control was rising. According to Time/CNN/Yankelovich Partners Poll, 70% of Americans favored stricter gun laws and only 27% opposed. Congress passed the Brady Bill that same year. The bill required a five-day waiting period for background checks prior to the purchase of all guns. A Gallup Poll from 1999 showed that 89% of Americans were still in favor of the law.

In 1994, Congress passed the Federal Assault Weapons Ban, which banned the sale and manufacture of specific semi-automatic firearms. After the law took effect, crimes with those banned weapons went down. But overall gun violence did not drop much. According to Christopher Koper, Professor at George Mason University, who studied the ban for the Justice Department, the law’s effects were limited because many older guns and magazines were still legal and widely available. The ban expired in 2004 and was not renewed, not because it was proven to fail, but because Republicans controlled Congress at the time.

Immediately following the 1999 Columbine school shooting, Princeton Survey Research Associates/Newsweek Poll found that only 11% of adults thought that stricter gun laws would be the best solution. The majority (49%) thought that there should be a larger focus towards kids who are anti-social. Also, 21% believed that schools should increase security and a few (14%) claimed that reducing violence in entertainment would be the solution.

Public support for stricter gun laws was less in the early 2000’s compared to 1993. A Time/CNN/Yankelovich Partners Poll found that 59% of Americans favored, and 35% opposed, stricter gun laws. This decline was short-lived as more and more terrorism attacks occur.

A few years after 9/11, a 2006 NORC General Social Survey found that 77% of Americans thought that gun laws should be stricter because of terrorism attacks. This increase from the early 2000’s shows that, as threats to public safety increase, more Americans are in favor of stricter gun control laws. This trend continued into 2007. Following a mass shooting at Virginia Tech University, a CBS News/New York Times Poll found that 32% of Americans believed that stricter gun laws could have prevented the incident. Furthermore, 21% believed it would have done at least a little bit. At the time, as terrorism attacks and mass shootings increased, so did support for stricter gun laws.

A major turning point in the gun debate came not from public opinion, rather the Supreme Court. The 2008 Supreme Court case District of Columbia v. Heller involved a special police officer, Dick Heller, who challenged the city’s laws that banned handgun registration and required that firearms must be kept unloaded and disassembled or trigger locked. He argued it violated the Second Amendment because guns at home should be available for personal protection. The court agreed with him, ruling the Second Amendment protects the rights to keep an operational gun at home for self-defense. The ruling strengthened individual gun rights even as many Americans supported stricter gun laws.

In the early 2010’s, mass shooting were happening more frequently, particularly in schools. After the 2012 Sandy Hook Elementary School in Newtown, Connecticut, Americans were left with the same question, would stricter gun laws have helped? A CBS News Poll found that the public was divided, with 26% thinking stricter gun laws would have helped a lot, 16% a little and 51% had no effect.

Also, in the wake of the mass shootings at a 2017 concert in Las Vegas and the 2018 Parkland school shooting, a Marist Poll/NPR/PBS Newshour found many 59% believed this country needs stricter gun laws. Only 25% believed that more people need to carry guns.

In April 2023, a Beacon Research/Shaw & Co. Research/Fox News Poll found that 43% of registered voters believed that stricter gun laws would make the country safer, while 25% believed it would make the country less safe. Many Americans today believe gun control can make our country safer but there is still a large number that disagree or feel it won’t make a difference.

Today, the debate over gun control versus gun rights remains deeply divisive. While support for stricter laws often rises after mass shootings, new laws don’t follow. Court rulings, politics, and different views on safety and gun rights all play a role. As shootings continue, many are left asking: how can the U.S. reduce gun violence while still protecting individual rights?

This post was written by Marist Poll Media Team member Tommy Rogers.

robot looking at camera

Time Machine: Concern About AI

Artificial intelligence once felt like something out of a movie, like C-3PO from Star Wars stepping off the screen and into real life. But, now, that future is real. People use AI to help with almost every part of life, even if they don’t realize it. People once saw AI as a futuristic idea, but now it has become a key part of everyday life. How did we get here, and how do Americans feel about AI? Let’s start by looking at how public opinion about AI has changed over time.

Back in 1965, a Louis Harris & Associates Poll asked Americans if they felt threatened by automation at work. Only 8% said yes. More than three in four said it wouldn’t make a difference. Most people didn’t worry about machines or robots taking their jobs. People saw technology back then more as a tool to help with work than a replacement for human workers.

That view has shifted as the technology has radically improved.

By 2008, awareness and concern about automation increased. A NORC/General Social Survey found that, of those full-time workers aged 25-62 who used a computer at work, 16% had heard of jobs at their own workplace being replaced by computers or some form of automation in the past three years. Technology kept advancing but most people had not yet seen the effects of automation in their own job. 

In 2011, public awareness of artificial intelligence grew rapidly. A Pew Research Center for the People and Press/Princeton Survey Research Associates International poll found that 22% of Americans heard a lot about IBM’s computer Watson winning Jeopardy!, and 35% heard a little. So, more than half of Americans had heard about AI and started to pay attention.

In 2017, as AI tools became more a part of everyday life, another Pew poll (Abt Associates/Pew Research Center) found that 46% of Americans used voice-controlled digital assistants like Apple’s Siri, Amazon Alexa, Google Assistant, or Microsoft Cortana. That meant almost half the population was now interacting with AI at least occasionally.

Now, in the “Age of AI,” what do people think? Earlier this year, a Quinnipiac University Poll found that 56% of Americans believe AI will decrease job opportunities. Only 13% said AI would help create more jobs. Another 24% of people believed that AI wouldn’t change the number of jobs.

But what about the benefits of AI? That same poll showed that many people already use AI tools in everyday life. They use it in many different aspects of work like writing emails, creating images, and analyzing data. Some now use AI to have conversations with bots. But there’s plenty of concern, too. Americans started asking who’s responsible for AI and who makes the rules? 

That Quinnipiac poll from earlier this year found 69% of Americans said the government wasn’t doing enough to regulate AI. Another concern was trust. When asked whether AI is being developed by people or companies who represent their interests (public’s best interest), the majority said no or that they didn’t know enough to say. Only 5% thought AI developers were on their side.

Over time, Americans have started using AI more in daily life. Polls show that even as the use increases, many remain unsure about how AI works and who controls it. Most believe the government is not doing enough to regulate AI. AI is advancing fast but the public still has many questions and concerns.

This post was written by Marist Poll Media Team member Tommy Rogers.

signs pointing in opposite directions saying Justice or Cruelty

Time Machine: Life or Death?

How has time changed Americans’ perspective on the death penalty? This week we’re taking a look back at the evolution of public opinion on capital punishment from the early 20th century to the present day.

Capital punishment has been a part of American history since the country’s inception. The first recorded death sentence in the American colonies was issued in 1608. Fast forward to 2025, and the situation is dramatically different: 144 countries have abolished the death penalty, leaving the U.S. in the minority. Currently 27 states continue to carry out capital punishment, along with the federal government and the military.

Public opinion on capital punishment has fluctuated over the decades. In one of the earliest polls on the topic during 1936, Gallup asked respondents if they supported the death penalty for murder. 61% of respondents were in support while 39% opposed. Gallup has continued to ask this question over the decades and by 1956, support had grown a bit to 64% with 34% opposed. But in the 1960s, attitudes appeared to shift: in 1966 47% of Americans said they opposed the death penalty for murder while 42% approved — the lowest level of support Gallup has ever found over decades of polling on the topic.

Indeed the very next year, 1967, approval for the death penalty in murder cases shot back up to 54% as unrest related to Civil Rights and the Vietnam War began to dominate headlines. Whether they were related is unclear.

As the 1970s unfolded, support kept climbing…and didn’t stop for several decades. Gallup found 66% support in 1976, 72% in and 80% in 1994 — the highest number Gallup has yet seen supporting the death penalty.

However, in the 2000s, the tide began to turn. When Gallup polled in 2008 64% of respondents still supported the death penalty for murder convictions, but 30% were opposed—a noticeable increase in opposition compared to past decades. By 2017, support was at 55% and opposition at 40% — the closest narrowest gap between support and opposition on this topic since 1972.

The conversation surrounding the death penalty have continued to evolve, especially as multiple states have abolished capital punishment for some crimes.

Over the past couple of years, public opinion has remained divided with a small majority supporting the death penalty. Most recently, in 2023, Gallup polled on capital punishment for murder convictions and 53% of respondents backed the penalty while 44% opposed.

The death penalty debate in America is no longer simply about “guilt” or “innocence” but has grown into a complex issue of fairness, ethics, and justice. In some ways, the data mirrors the slow unraveling of support for the practice and the end of the punishment in many states.

What does the future of capital punishment look like in the United States? While support may be steadily decreasing and many states have now banned the practice, other states — and the second Trump Administration’s Department of Justice — continue to sentence people to death and have, in some cases, moved to expand its use. Will public opinion follow?

This post was written by Marist Poll Media Team members Hunter Petro and AJ Gambino.

a vaccine and a vial

Time Machine: Trust in Vaccines

When a vaccine for polio was first introduced, humans had been grappling with the devastating effects of the disease for eternity. So, on the cusp of the cure, a February 1954 Gallup/National Foundation for Infantile Paralysis poll asked Americans, “If polio is finally licked, what would you say are the things which brought about the defeat of this disease?”

A majority, 63%, pointed to “research, science, experimentation, and doctors,” while 29% said people’s financial contributions made the difference. Just 13% credited vaccines or medicine.

But that didn’t mean the vaccine wasn’t popular. One year later, in April 1955, 84% of Americans told Gallup that they planned to have their child vaccinated with the new polio vaccine

Vaccines were broadly seen as the future of medicine.

In fact, 30 years later and a 1985 Opinion Research poll showed any concern about the safety of vaccines barely registering. Only 3% of Americans listed them as a top three health risk.

Public support for vaccines has often been strongest when outbreaks occur. In February 1991, a German measles outbreak spread among religious communities that refused vaccination, raising the question: Should the government step in?

A Lifetime Television/Princeton Survey Research Associates poll at that time found that 61% of Americans said yes, while 26% believed the government should stay out of it. When asked if vaccinations should be mandated for all children, support was even stronger, with 81% saying yes, while only 14% opposed.

A decade later Gallup found that 73% of Americans had heard “a great deal” or a “fair amount” about the advantages of childhood vaccinations. Almost everyone, 98%, agreed that vaccinating children was “extremely, very, or somewhat important.”

But vaccine hesitancy has always been an undercurrent. In 2002, the Harvard School of Public Health & International Communication Research asked about the smallpox vaccine’s effectiveness, and Americans were evenly split. 46% believed it would provide serious protection, while 48% were doubtful.

Then came COVID-19.

In August 2020, 46% of Americans told the Associated Press/AP-NORC they planned to get the COVID-19 vaccine. A quarter of respondents refused outright, and 29% weren’t sure.

By December 2020, when ABC News/Ipsos asked whether states should make the COVID-19 vaccination mandatory for people returning to work, 39% supported the idea, while 61% were against it.

Concerns about the vaccine were widespread. In January 2021, 37% of Americans told KFF/SRSS that fear of side effects was their main hesitation. Another 11% cited the speed of development and lack of adequate testing.

By April 2021, Fox News/Beacon Research/Shaw & Co. Research found that 28% of registered voters were still worried about how quickly the vaccine had been developed, and 16% didn’t believe it would work.

Debates over vaccine requirements extended to “vaccine passports.” In April 2021, Quinnipiac found Americans split, 49% thought requiring proof of vaccination was a good idea, while 45% disagreed.

And now, with COVID still circulating but attention having waned, vaccine skepticism has reached new levels of acceptance.

A new measles outbreak is spreading in Texas, infecting 200-300 people so far. The United States has withdrawn from the World Health Organization and fired hundreds of “disease detectors” from the CDC. And the new head of Health and Human Services, Robert Kennedy Jr. has a long history of making dubious claims about vaccine risks.

It’s been a long time since Jonas Salk and his polio vaccine were heralded as ringing in the age of modern medicine.

This post was written by Marist Poll Media Team member Hunter Petro.

rocket blasting off

Time Machine: Space Travel

As the portion of the population who remembers the hysteria of the space race is beginning to decline, is there a possibility for a revival of American enthusiasm for space travel? American support for outer space exploration is a multifaceted issue which draws its conclusions from how well a number of spheres of the government, including international relations, and economic prosperity, are doing.

At the height of the space race, American innovation was largely fueled by a national competitiveness with the U.S.S.R. In December 1959, Gallup found only 35% of Americans believed that the United States would be the first country to send a man to the moon, while 44% believed the Soviet Union would reach this feat first. This fear of Soviet advancement and superiority reflected larger Cold War tensions, as, from the same poll, only 34% of Americans believed that the U.S. was ahead of Russia in the field of long-range missiles and rockets.

American support for space travel boomed, with Cold War tensions and economic prosperity of the post war decades being cited as the major reasons, as, in a 1965 Washington Post/Harris Poll, only 38% of Americans noted that they would support the U.S. space program if the Russians were also not going into space.

American pessimistic fear of Russian superiority prompted mass federal spending towards space advancement, with $30 billion being allotted by the U.S. government to the space race between 1957 and 1969. This allocation was well received, with 68% of Americans in 1969 General Electric survey approving of America’s attempt to send a man into space.

The moon landing was a turning point for not only global technological advancement, but also American support. With the largest goal of the space race achieved, public support began to take a downturn throughout the latter half of the 20th century. A 1998 Gallup/CNN/USA Today Poll found only 21% of Americans believed that NASA funding should be increased.

While people were no longer sharing the same levels of enthusiasm for publicly funded space travel, interest in private space travel began to grow. With national competitiveness between the U.S. and the U.S.S.R. no longer a looming factor and economic interests largely lying elsewhere, people began to see space travel as a leisure possibility rather than a sign of national dominance.

In a 1999 CBS News Poll, only 21% of Americans expressed their willingness to take a “vacation cruise” to outer space. By May 2021, a Quinnipiac Poll showed this number at 34%.

Now, private space travel is not some far off dystopian idea but a growing reality, as companies such as billionaire owned companies such as SpaceX, Blue Origin, and Virgin Galactic have already launched commercial tourism flights into space. In a 2023 Ipsos/Pew Poll, 75% of Americans noted that they had heard of these companies, up from 63% in 2018. In terms of approval, as of June 2023, only 12% of Americans said that these companies were doing a “mostly bad job,” with 47% saying that they are doing a “mostly good job”.

While privatized space travel is still not widely available to the everyday American, its popularity and plausibility has grown tremendously. With the newfound relationships between the billionaire owners of these companies, such as Elon Musk and Jeff Bezos, and the federal government, we will see how support for privatized space travel might change during President Trump’s second term.

For more information on how Americans feel about the growing reality of private space travel, check out our recent episode of Poll Hub on this topic: https://poll-hub.simplecast.com/episodes/the-new-space-race-ev-stall-out

This post was written by Marist Poll Media Team member Neel Viswanathan.

security camera and American flag

Time Machine: Government Surveillance

Spies have been around forever, but, in this weeks’ Time Machine, we’re looking at the modern surveillance state…and what Americans have thought about it over the decades.

The formation of the NSA in 1952 marked the beginning of modern-day government surveillance and public opinion on privacy and security has slowly evolved ever since. Among the first poll questions asked about the topic, 63% of Americans supported federal wiretapping and 28% opposed it, in a 1974 Harris Poll. In 1982, an NBC News Poll took a different angle, finding 50% opposed reducing restrictions on FBI wiretapping, while 42% favored fewer restrictions.

A decade later as international terrorism began to worry Americans, an April 1995 Gallup/CNN/USA Today Poll found 58% of Americans saying that increasing surveillance to prevent terrorism was excessive, while 37% supported such measures. At the same time, widespread introduction of public surveillance cameras sparked debate, and, in March 1998, 53% of Americans felt cameras would reduce crime, though 34% felt they infringed on privacy, according to a CBS News Poll.

After 9/11, public support for surveillance took a sharp turn. In September 2001, the NBC/Wall Street Journal Poll found that 78% of Americans supported increased internet surveillance. Just a week later, 69% backed foreign surveillance in U.S. court cases, according to a TNS Intersearch/Washington Post Poll. By April 2002, a CBS News Poll reported that 77% approved of public video surveillance cameras.

The Patriot Act expanded government wiretapping capabilities. In July 2003, 55% of voters supported it and 27% opposed it, according to a Fox News Poll. Then again, a healthy minority didn’t actually know what it was! An April 2004 CBS/New York Times Poll found 30% of Americans said that they had heard nothing about it. When it came up for Congressional renewal in 2006, a Fox News Poll showed 57% supported renewal of the act, according to the poll, but 75% believed court orders should still be required for wiretapping, a Center for Survey Research Analysis found.

The Patriot Act also raised fears of profiling. In 2007, Pew Research reported that 45% of Americans felt Muslims were unfairly targeted for surveillance. Four years later that number remained nearly unchanged with 44% still feeling so in 2011. In 2013, Princeton Survey Research Associates International & Pew found that 70% of Americans opposed email surveillance, perhaps reflecting a renewed concern about privacy.

And that same year, Edward Snowden’s publication of problematic NSA surveillance activities resonated. Princeton Survey Research Associates International/Pew Research found that 55% of Americans felt the leaks harmed the public, while 34% believed they served the public interest. By 2015, 52% worried about government surveillance of personal communications, according to GFK Knowledge Networks/Pew Research.

The Patriot Act also raised fears of profiling. In 2007, Pew Research reported that 54% of Americans felt Muslims were unfairly targeted for surveillance, though this number dropped to 44% by 2011.

In 2013, Pew found that 70% of Americans opposed email surveillance, perhaps reflecting a renewed concern about privacy. And that same year, Edward Snowden’s publication of problematic NSA surveillance activities resonated. Pew Research found that 55% of Americans felt the leaks harmed the public, while 34% believed they served the public interest. By January 2015, 52% worried about government surveillance of personal communications, according to Pew.

As Artificial Intelligence rolled out in 2019, concerns about privacy expanded to the new technology. Ipsos/Pew reported that 70% of Americans felt their personal information was less secure than five years earlier. In November 2021, 16% expressed fear about AI’s impact on digital privacy, signaling the next challenge in addressing surveillance concerns.

Public opinion on surveillance has swung between acceptance and skepticism, driven by key events like 9/11, the Snowden leaks, and further advances in technology. The long-lasting debate reflects a tension between prioritizing national security and protecting individual privacy in an increasingly digital world.

This post was written by Marist Poll Media Team member Hunter Petro.

mortar boards in the air

Time Machine: Student Loans

Can you put a price on knowledge? Though massive student loans are a relatively recent phenomenon, their impact on American society has been unmistakable.

Student loans were first introduced by the American government through the National Defense Education Act of 1958. The NDEA provided students seeking graduate and undergraduate degrees in defense-related fields with low interest loans. In the midst of the Cold War, the NDEA was necessitated by the Soviet Union’s launching of the Sputnik 1, the first artificial satellite to orbit Earth, a year earlier. A byproduct of the space race, the NDEA encouraged participation in STEM-related fields however did not yet cause significant financial accumulation and burden.

In 1965, President Lyndon B. Johnson signed the Higher Education Act which expanded federal student aid programs and guaranteed loans issued by private lenders.

Though Americans grew increasingly reliant on federal loans, once Reagan assumed the presidency in 1981, he cut federal spending, decreasing access to federal student loans. In 1981, a Yankelovich, Skelly & White/Time Magazine Poll of registered voters found 28% said that they have been affected by cutbacks to federal student loans.

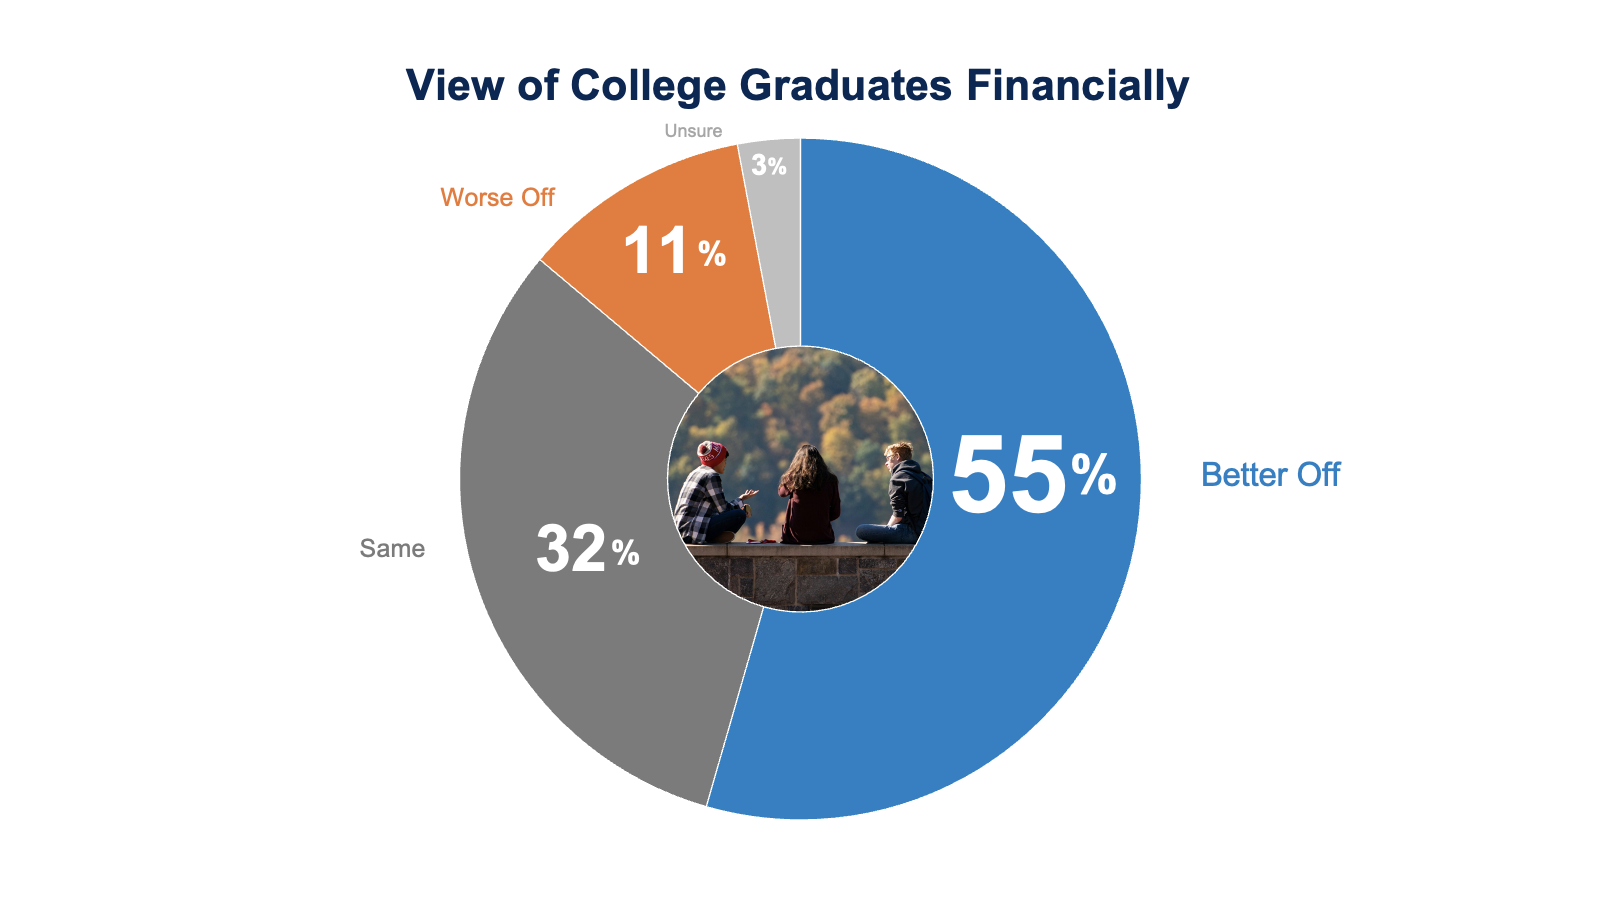
Over the next decade, concerns grew, and, by 1991, a Yankelovich Clancey Shulman/Time Magazine/CNN Poll found that 57% of Americans believed that more government spending should go towards student loans and grants

By 2003, an ICR/Debt Relief Clearinghouse Poll found that 68% of Americans noted that existing or future student loans prevented them from spending money on other things such as a house and a car. This number continued to rise, as a GfK Knowledge Networks/Harvard Institute of Politics poll in 2012, found that 73% of Americans aged 18-29 noted that their financial circumstances going forwards would be impacted by student loans.

Sensing a rising student debt problem, Presidents Obama, Trump, and Biden all either initiated or proposed legislation focusing on student debt relief. The Obama administration implemented Income Driven Repayment (IDR) plans which reduced monthly payments to a percentage of one’s income, with forgiveness of the total balance after 20-25 years. The Trump administration attempted to cap these IDR payments at 12.5% of one’s income, which the administration noted would reduce costs and streamline IDR plans. This plan never materialized.

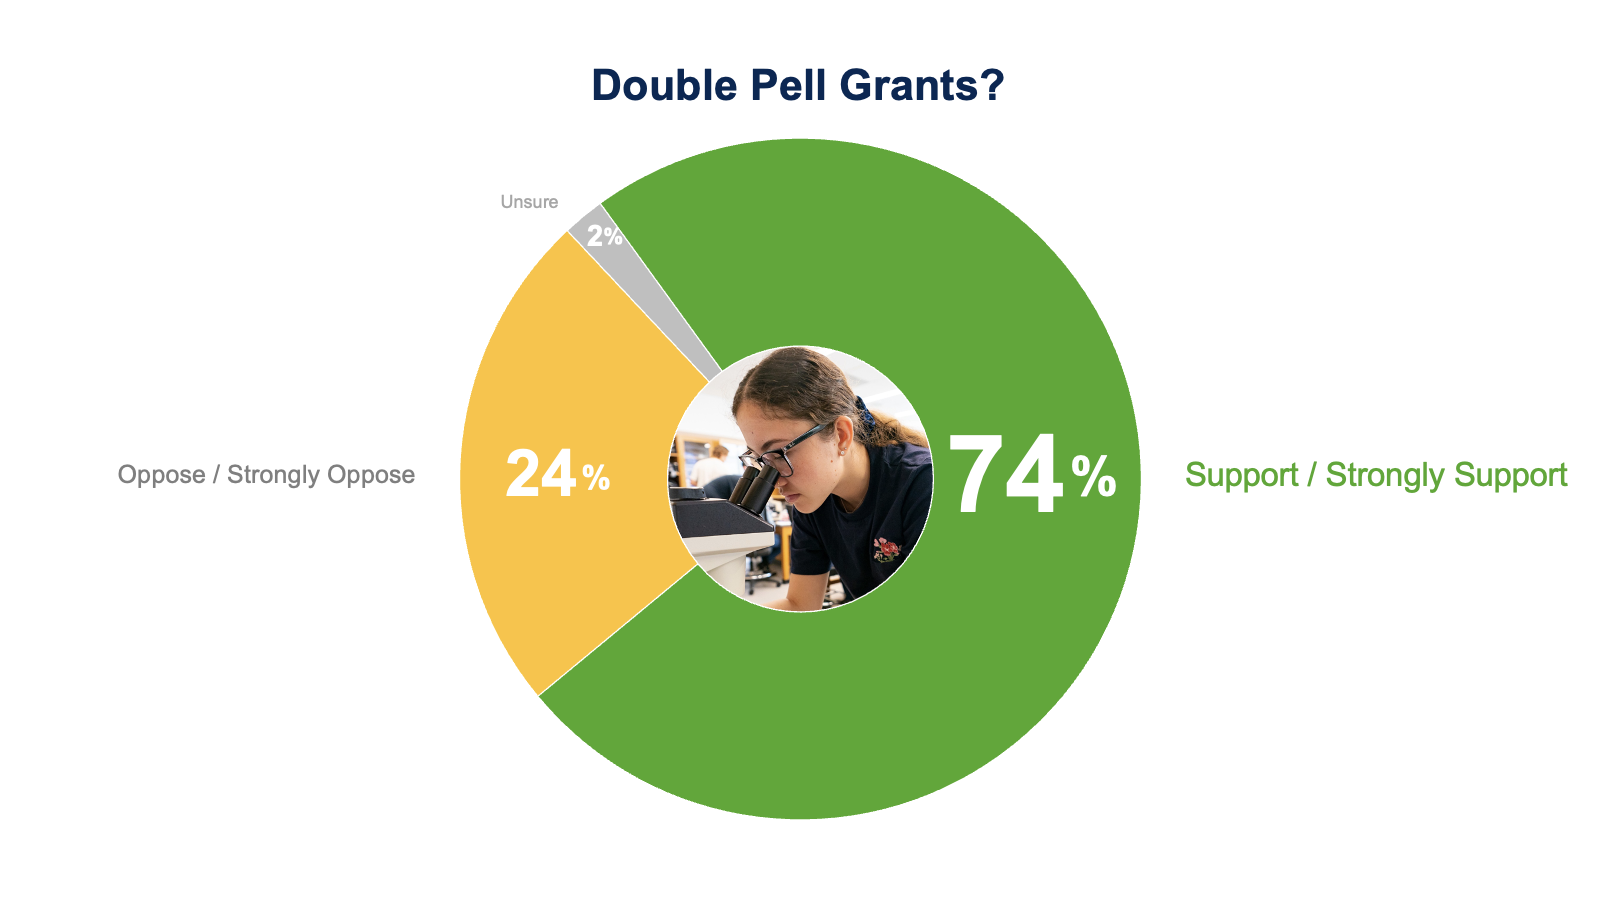
The Biden administration proposed a mass-forgiveness plan which would cancel up to $20,000 in debt, however was struck down by the Supreme Court, despite a May 2024 AP-NORC Center for Public Affairs Research/University of Chicago School of Public Policy Poll finding out that only 23% of Americans oppose loan forgiveness after 20 years. 

So, where does this leave us?

According to a September 2024 Pew study, one in four American adults under 40 have student loan debt, with Americans collectively amassing $1.6 trillion in student loan debt. Despite this, that 2024 AP-Norc/University of Chicago Poll found that only 29% of Americans oppose federal loan forgiveness, but a 2024 Ipsos/ABC News poll found that 42% of Americans still believed that Biden was doing too much on this issue.

As Trump gets ready to assume his second term, we will see if his newfound popularity among Gen Z voters will change the way in which he approaches federal student loans.

This post was written by Marist Poll Media Team member Neel Viswanathan.

ice bergs in the ocean

Time Machine: Climate Change Awareness

Buckle up! Let’s see how the world went from “What’s climate change?” to “Can we survive it?”

In 1967, scientists created the first climate model, which was basically Earth’s “forecast” for the next several decades. By 1968, Dr. John Mercer warned the world about melting ice caps, but the public reaction was mostly “ice…melting? Okay, but there’s plenty in the freezer, right?” In fact, in 1969, only 2% of U.S. adults thought “changes in weather or climate” were serious issues. That was from an Opinion Research Corporation Poll.

Fast-forward to 1988, when the Intergovernmental Panel on Climate Change (IPCC) is formed, just in time for one of the hottest summers on record. That same year, 47% of U.S. adults in a Parents Magazine-Kane, Parsons & Associates, Inc. poll thought that climate change wouldn’t show up until future generations, while 42% started to think they might feel the heat in their lifetimes. By 1989, a Union of Concerned Scientists-Reasearch/Strategy/Management poll found that 20% of people said they were “extremely worried” about global warming. Still, 14% shrugged and said they’re “not worried at all.”

By 1997, most people still weren’t too concerned. In a CBS News/New York Times Poll, 10% blamed weird weather on El Nino or global warming, while 34% say they hadn’t heard much about the topic at all.

Then came Al Gore’s “An Inconvenient Truth” in 2006, a documentary credited with sparking a global decarbonization movement. That year, Pew found two-thirds of U.S. adults said they could find the information they needed on climate change. But when asked to name a specific website, 58% drew a blank.

Just a few years later, the tide seemed to change. In a 2009 University of Maryland survey, 52% thought other countries would follow if the U.S. led on climate action, and 82% said it was our responsibility to act.

But just a month later that same year, Pew found a huge DROP in the number of Americans saying there was “solid evidence” of global warming from 79% in 2006 to 57% in 2009. Was it skepticism fueled by the Great Recession? Political polarization? Either way, this marked a dramatic shift.

The Paris Agreement of 2016 brought some hope to the world as 195 nations came together to reduce carbon emissions. But then, President Trump withdrew the U.S. from the accords.

After Joe Biden won in 2020, the U.S. reupped government efforts to deal with climate change but Americans were pretty divided about it all.

Gallup Poll in 2021 found 59% of Americans said global warming effects were already here — but there was a large partisan divide:

82% of Democrats said this, 59% of independents agreed, but just 29% of Republicans thought the same.

Jump to 2024, and an AP/NORC University of Chicago Poll showed 78% of Americans now “believe” in climate change, but fewer, 54%, think it’s human-driven. And in both cases, a vast partisan divide is evident.

Climate change is no longer a question of “if” but more “how.” How do we adapt, slow, and overcome the challenges posed by global warming? The data shows a clear course: awareness is growing, but division remains. Our greatest challenge, bridging these gaps, remains.

This post was written by Marist Poll Media Team member Hunter Petro.

laptop with stock graphic

Time Machine: Stock Ownership

How will the market do this week?

In this week’s Time Machine, we dive into the history of stock ownership in the United States. The stock market is a market of owners who own shares of corporations and has been active in the United States since 1792 when a group of 24 brokers started the New York Stock Exchange. The first ever stock exchange came FAR earlier, however, set up in 1309 in Bruges, Belgium.

Public opinion surveys have asked questions about the stock market and exchanges since the early 1930s. Today, we travel through time to explore how American’s relationships with investment accounts have changed over the decades. In the wake of the 1929 stock market crash, known as Black Tuesday, public trust in the stock market crashed, too.

A poll conducted by Fortune Magazine in August 1938 found that only 9% of Americans would put money into “stocks or bonds” if they had a substantial sum. The crash had sparked a deep-rooted fear of market investments, with people preferring safer options for their money. Like sticking it under their mattresses.

Fast-forward a few decades. In 1977, Cambridge Reports and Research International conducted a poll that found 42% of Americans had not heard of an IRA (Individual Retirement Account) which had been introduced just a few years earlier in 1974. Congress created IRAs to give average Americans a chance to invest in the market for their retirement. They took time to catch on.

In 1979, a Roper Report found that 51% of Americans still felt most comfortable putting their money in a savings account, while 9% saved it in stocks or mutual funds, and 3% used an IRA. That same year, Opinion Research Corporation found that 85% of Americans had low-medium trust in the stock market, with only 10% having a high level of trust in the market. Maybe because the 70s saw the lowest rate of return in the markets since the 1930s.

Then things began to change. By 1996, a survey from Matthew Greenwald & Associates found that 47% of Americans said they had IRAs, and a 1997 ABC News Poll found that 54% of Americans had money invested in stocks or mutual funds, including retirement plans. While the decade started off with a market recession, the 1990s Clinton economic boom made checking IRAs a new habit.

But even through the dot com boom went bust, a majority of Americans were now invested in the stock market. As the economy recovered, stock ownership reached all-time highs in 2007, with 65% of US Adults invested in the market, and 68% of Americans saying it’s a good idea to “invest now,” according to Gallup polling.

And then another bust — and this time, it was a biggie. By late 2008 after the financial crisis, Gallup found just 42% thought investing at that time was a good move, with 55% calling it a “bad idea” to invest in the market. 70% of Americans were concerned that the crash would affect them in the long term, according to an October 2008 USA Today/Gallup poll, with 40% calling it the biggest financial crisis of their lifetime.

But since then, the markets have moved up and to the right in one of the longest boom cycles in stock market history.

Nonetheless, Americans appear not to have forgotten the pain — despite all major indexes hitting record highs nearly every year since a 2023 Gallup Poll reported that 61% of Americans said they owned a stock investment — still below Gallup’s 65% peak in 2007.

Looking back on stock market sentiment over the decades, it’s clear that American attitudes toward investing have been shaped by trial and error. From the cautious approach of the 1930s to the overwhelming participation of the 1990s and the mixed feelings following the 2008 crisis, the journey of stock ownership in the U.S. tells a unique story that perfectly encompasses the American dream. Despite the downturns and scares, remain optimistic and invested, and there will always be a brighter tomorrow. Whether you’re a seasoned investor or just starting out, it’s important to understand the historical patterns as you look to the future.

This post was written by Marist Poll Media Team member Hunter Petro.

trick or treaters

Time Machine: Back to Halloween

Yes it’s Labor Day but since Halloween decorations have been in some stores since July….this week’s Time Machine jumps back to when Halloween was spookier than ever!

Have we become lazy when it comes to America’s scariest day?

Well let’s go back to 1999 when Gallup asked Americans whether their children would be wearing a costume that year for Halloween. A majority of 84% said they would be and only 14% said they would not.

Let’s jump forward 12 years to 2011 and see if kids still have the Halloween spirit!

CBS News asked Americans whether or not their kids would be wearing a costume. This time 76% said they would 26% said they would not. A majority of kids are still participating in the festivities, but a growing number are sitting out of dressing up.

Jump a few years forward to 2013 and the numbers only dwindle more. CBS News asked the same question and this time 67% said yes and 31% said no they would not.

Well America’s kids are slowly losing the spirit of dressing up as their favorite characters, but what about their parents?

Do people still give out candy for trick or treaters?

Fox News asked Americans in 1997 whether they would have candy for trick or treaters.

72% said yes and only 26% said no they would not. Overall, most people were ready to hand out treats.

Now let’s hop forward a few decades to 2021 and see if this still holds up.

CBS News asked the same question and found only 49% said yes and 48% said no to giving out treats.

What is happening to Americans’ Halloween spirit!?

This post was written by Marist Poll Media Team member Athen Hollis.