January 15, 2014
1/15: Chris Christie’s Bottlenecked Political Future
NBC News/Marist New Jersey Poll
Has New Jersey Governor Chris Christie’s image suffered nationally because of the controversy surrounding his administration’s role in the traffic tie-ups on the George Washington Bridge in September of last year? According to this NBC News/Marist Poll, while 69% of Americans say the political uproar has not had any effect on their opinion of Christie, close to one in five — 18% — likes him less because of it. Five percent like him more, and 8% are unsure. Among Americans who have heard about the bridge controversy, 24% say their dislike for Christie has grown.
 Click Here for Complete January 15, 2014 USA NBC News/Marist Poll Release and Tables
“The question is can Chris Christie weather this political storm, or is this another in a list of considerable hurdles he will need to overcome if he wants to make a run for the White House,” says Dr. Lee M. Miringoff, Director of The Marist College Institute for Public Opinion.
By party:
- Nearly seven in ten Republicans — 69% — report the political brouhaha has had no impact on how they view Christie. However, 16% like him less. Only 8% like him more, and 7% are unsure.
- Among Democrats, 61% report the issue has had no impact on their opinion of Christie. However, 28% say they like him less, and just 3% like him more. Eight percent are unsure.
- Looking at independent voters, 73% report the issue has had no effect on their impression of Christie. Still, 17% like him less, and 5% like him more. Five percent are unsure.
A plurality of Americans believes New Jersey Governor Chris Christie’s assertion that he played no role in creating traffic jams on the George Washington Bridge for political retribution. 44% of adults nationally say Christie is mostly telling the truth that he had no knowledge of the events that led up to the traffic tie-ups. However, a notable 33% report he is mostly not telling the truth, and an additional 23% are unsure.
Americans who have heard about the bridge controversy are more likely to think Christie is being honest. A majority of these Americans — 52% — thinks Christie is telling the truth compared with 34% who believe he is not. 15% are unsure.
By party:
- While 61% of Republicans think Christie is mostly telling the truth, 20% believe he is not being forthright. 19% are unsure.
- Not surprisingly, a plurality of Democrats — 41% — says Christie is not telling the whole truth. However, 34% report he is being honest with the public. 24% are unsure.
- Nearly half of independent voters — 47% — think Christie is telling the truth while 31% say he is not. 23% are unsure.
Do Americans know that members of Christie’s staff have been implicated in creating these traffic jams? Slightly more than seven in ten residents — 71% — have at least some knowledge of the political scandal. This includes 39% of Americans who know a lot about the story and 32% who have some awareness of the controversy. 30% report they know nothing about the issue. Do Americans think Governor Christie is a bully or a strong leader? Nearly half — 47% — say he comes across as a strong leader while 27% describe him as a bully. 26% are unsure.
By party:
- About seven in ten Republicans nationally — 71% — consider Christie to be a strong leader. 11% call him a bully, and 18% are unsure.
- There is little consensus among Democrats. 38% say he is a bully while 36% think he comes across as a strong leader. 27% are unsure.
- 47% of independent voters think Christie is a strong leader while 26% believe he is a bully. 27% are unsure.
Table: Awareness of the George Washington Bridge Traffic Controversy
Table: Does New Jersey Governor Chris Christie Come Across as a Bully or Strong Leader?
No Clear Front-runner in Crowded GOP Field… One in Four Undecided
There has been much speculation about whether or not Christie will seek the Republican nomination for president in 2016. How would Christie fare against his potential GOP opponents?
Among Republicans nationally including Republican leaning independents, here is how the contest stands:
- 16% Chris Christie
- 12% Paul Ryan
- 9% Rand Paul
- 8% Jeb Bush
- 7% Marco Rubio
- 6% Rick Perry
- 5% Rick Santorum
- 5% Ted Cruz
- 4% Scott Walker
- 3% Bobby Jindal
- 25% undecided
When Marist last reported this question in December, Christie had the support of 18% of Republicans and Republican leaning independents. Paul received the backing of 12% while Ryan — 11%, Cruz — 10%, and Bush — 10% followed closely behind. Sarah Palin garnered 8%, and Rubio had the backing of 7%. At the time, Walker and Santorum each received 4% while 3% supported Perry. 13%, then, were undecided.
How would the GOP contest look without Christie in the mix? Among Republicans nationally including Republican leaning independents, here is how the contest stands without Governor Chris Christie:
- 15% Paul Ryan
- 11% Rand Paul
- 11% Jeb Bush
- 10% Marco Rubio
- 7% Rick Santorum
- 6% Ted Cruz
- 6% Rick Perry
- 5% Scott Walker
- 4% Bobby Jindal
- 26% undecided
“The Republican field for 2016 clearly lacks a front-runner with or without Chris Christie,” says Dr. Lee M. Miringoff, Director of The Marist College Institute for Public Opinion.
Table: Potential 2016 Republican Presidential Primary or Caucus
Table: Potential 2016 Republican Presidential Primary or Caucus without Chris Christie
Clinton Widens Lead over Christie in Hypothetical Contest
If Hillary Clinton and Chris Christie were to face off in the 2016 presidential election, Clinton would defeat Christie by double digits. Half of registered voters — 50% — would support Clinton compared with 37% for Christie. 12% are undecided. When Marist last reported this question in December, voters divided. 48% supported Clinton while 45% were behind Christie. Seven percent, at that time, were undecided.
By party:
- Most Democrats — 90% — would support Clinton compared with 3% for Christie. Seven percent are undecided. Last month, 85% were for Clinton while Christie garnered 10%. Five percent were undecided.
- More than three in four Republicans — 78% — would cast their ballot for Christie compared with 16% for Clinton. Six percent are undecided. In December, 89% of Republicans supported Christie compared with 6% for Clinton. Four percent, at that time, were undecided.
- Independent voters divide. 40% would support Clinton, and 40% would back Christie. 19% are undecided. When this question was previously reported, a majority — 52% — backed Clinton while 40% were for Christie. Eight percent, then, were undecided.
There is a gender gap. While a majority of women would support Clinton, men divide. Among women, 56% back Clinton while 33% are for Christie. 11% are undecided. Among men, 44% are for Clinton compared with 42% for Christie. 15% are undecided.
Table: Potential 2016 Presidential Contest: Clinton/Christie
Half of Americans View Clinton Favorably… Christie Still Unknown to More than Four in Ten
50% of adults nationally have a favorable view of Clinton. However, 38% have an unfavorable impression of her. 12% have either never heard of her or are unsure how to rate her. When it comes to Chris Christie, 28% of Americans have a favorable view of him while 30% have an unfavorable one. A notable 42% have either never heard of him or are unsure how to rate him.
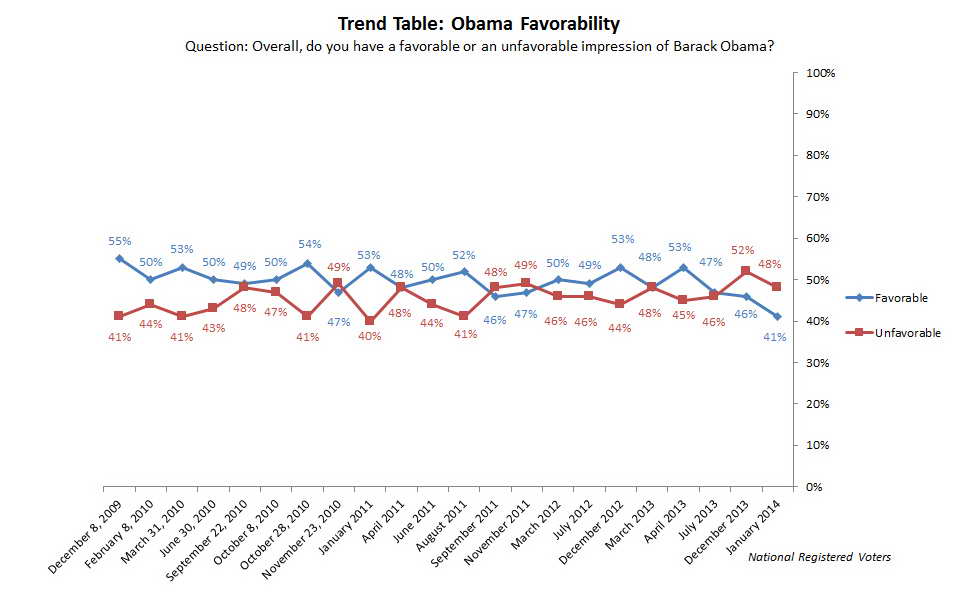
How do Americans currently rate President Barack Obama? Nearly half of residents — 48% — have an unfavorable impression of the president while 41% have a favorable one. 11% have either never heard of him or are unsure how to rate him.
Looking at registered voters, there is no difference. 48% have an unfavorable view of President Obama while 41% have a favorable view of him. 11% have either never heard of him or are unsure how to rate him. In December, a slim majority of registered voters — 52% — had an unfavorable opinion of the president while 46% had a favorable one. Three percent, at that time, had either never heard of Mr. Obama or were unsure how to rate him.
Table: Hillary Clinton Favorability
Table: Chris Christie Favorability
Table: President Obama Favorability
Table: President Obama Favorability (Over Time)

