December 10, 2013
12/10: Disapproval of Obama and GOP Congress at All-Time High
McClatchy/Marist National Poll
Voters nationally are dissatisfied with the country’s elected officials and the state of the nation. While President Barack Obama’s job approval rating hovers in the low 40’s, a majority of registered voters say they are displeased with how President Obama is doing his job. To make matters worse for the president, it is the first time a majority of Americans have an unfavorable view of him.
President Obama isn’t alone. The job approval ratings of the Republicans and Democrats in Congress continue to be low, and voters’ dissatisfaction with the Congressional GOP is at its highest. Many voters give the nation’s elected officials in Washington poor grades. Americans’ attitudes toward the direction of the nation are pessimistic. The proportion of adults who think the country is off track is the largest in more than two years.
“The government shutdown and the troubled launch of Obamacare have confirmed for many Americans that Washington is broken,” says Dr. Lee M. Miringoff, Director of The Marist College Institute for Public Opinion. “There certainly isn’t any grade inflation when it comes to how Americans rate the nation’s political leadership.”
Click Here for Complete December 10, 2013 USA McClatchy-Marist Poll Release and Tables
POLL MUST BE SOURCED: McClatchy-Marist Poll
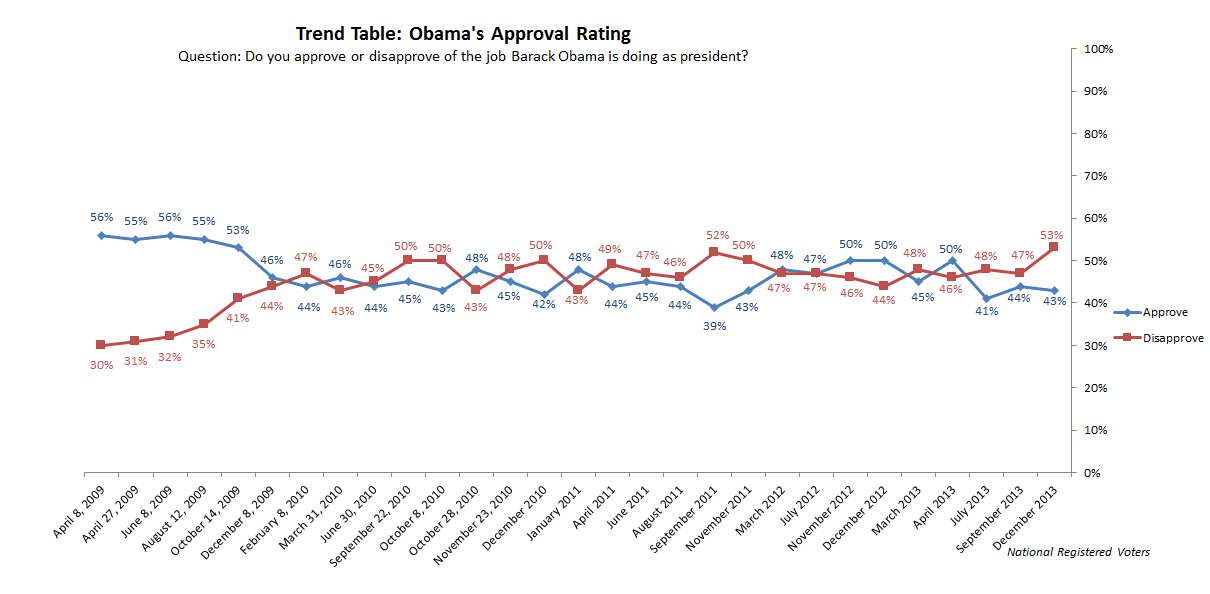
When it comes to President Obama’s job performance, 43% of registered voters approve of how he is doing. However, a majority — 53% — disapproves of his job performance. Four percent are unsure. This is the president’s highest disapproval rating since taking office. When McClatchy-Marist last reported this question in September, 44% of registered voters approved of how President Obama was doing in office. 47% disapproved, and 9% were unsure.
By party:
- Obama retains the support of his base. 77% of Democrats approve of his performance while 18% disapprove. Five percent are unsure. In September, 76% approved, 14% disapproved, and 10% were unsure.
- Most Republicans — 90% — disapprove of how President Obama is doing his job. Eight percent approve, and 3% disapprove. In September’s survey, 86% gave the president subpar grades, 10% thought well of his job performance, and 4% were unsure.
- Among independents, 41% approve of the job the president is doing. 56% disapprove, and 3% are unsure. In September, 39% of independents thought Obama’s job performance was on target. 50% believed it missed the mark, and 11% were unsure.
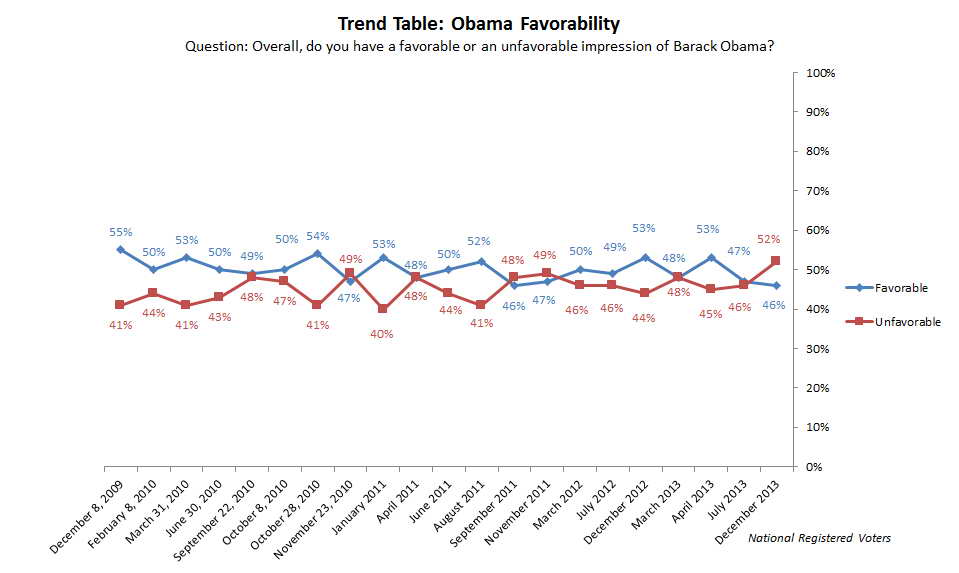
Looking at President Obama’s favorable rating, 46% of registered voters have a favorable view of Obama. For the first time, a majority — 52% — has an unfavorable impression of him, and 3% have either never heard of him or are unsure how to rate him.
When McClatchy-Marist last reported this question in July, 47% had a favorable opinion of the president. 46% had a lesser view of him, and 7% had either never heard of him or were unsure how to rate him.
Table: President Obama Approval Rating
Table: President Obama Approval Rating (Over Time)
Table: President Obama Favorability
Table: President Obama Favorability (Over Time)
Low Marks on Handling of Economy, Foreign Policy
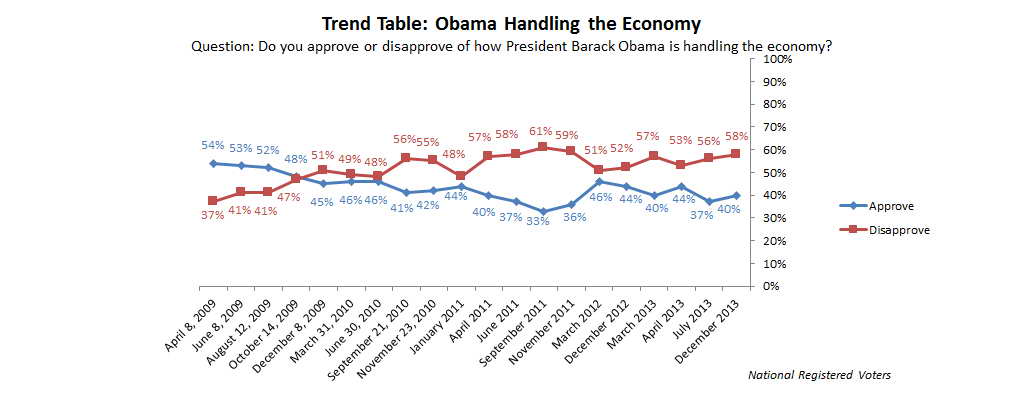
Only 40% of voters approve of how President Obama is dealing with the economy, and 58% disapprove. Two percent are unsure. The proportion of voters who disapproves is the largest since November 2011 when 59% said he fell short on the economy, and 36% of voters gave the president high marks. Four percent were unsure. When McClatchy-Marist last reported this question in July, 37% of voters approved of how Obama was handling the economy. 56% disapproved, and 7% were unsure.
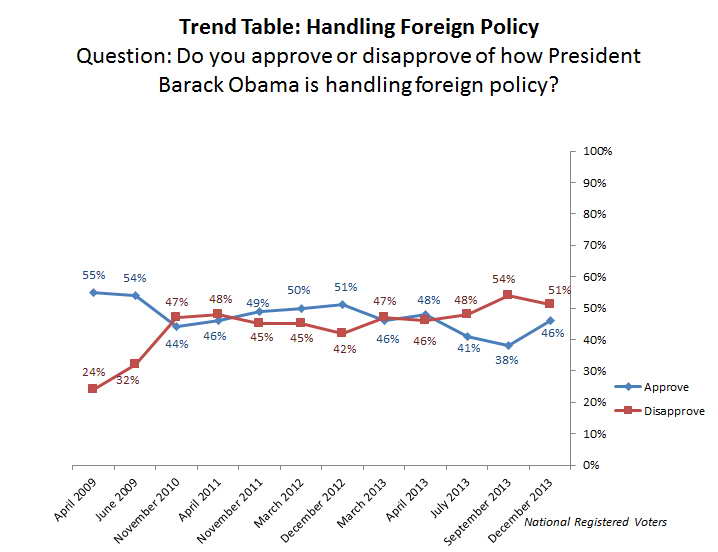
When it comes to foreign policy, 46% approve of how Obama is dealing with the issue while 51% disapprove. Four percent are unsure. While a majority disapproves of how the president is handling foreign policy, there has been an increase in his approval rating in this area. When McClatchy-Marist last reported this question in September amid heightened concern over the use of chemical weapons by Syria, 38% approved of how President Obama managed foreign affairs while 54% disapproved. Eight percent, at the time, were unsure.
Table: President Obama’s Handling of the Economy
Table: President Obama’s Handling of the Economy (Over Time)
Table: Handling Foreign Policy
Table: Handling Foreign Policy (Over Time)
Voters Dissatisfied with Congress
Voters nationwide do not hold the Republicans and Democrats in Congress in high esteem. Only 22% of voters approve of the job the Republicans in Congress are doing. 74% disapprove, and 4% have either never heard of them or are unsure how to rate them. The Congressional Republicans previously experienced their highest level of voter dissatisfaction in April when 71% said their performance was subpar.
When McClatchy-Marist last reported this question in July, 22% thought well of the job the GOP in Congress was doing. About two-thirds — 66% — believed they fell short, and 12% had either never heard of the Republicans in Congress or were unsure how to rate them.
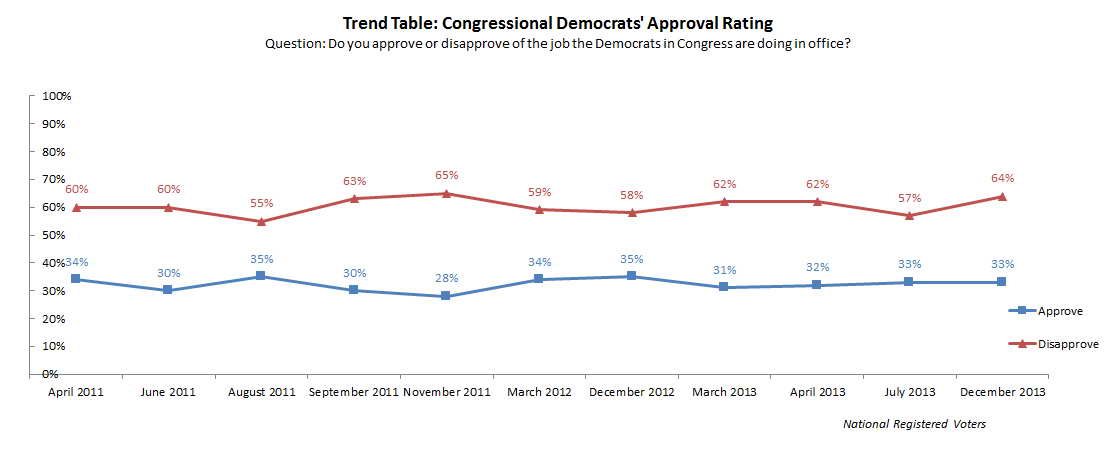
Looking across the aisle to the Democrats in Congress, 33% of voters approve of how they are doing their job while 64% disapprove, and 3% have either never heard of them or are unsure how to rate them. This is the highest level of voter dissatisfaction with the Congressional Democrats since November 2011 when 65% of voters gave Congressional Democrats low marks.
In McClatchy-Marist’s July survey, 33% approved of the job Congressional Democrats were doing in office. 57% disapproved, and 10% had either never heard of them or were unsure how to rate them.
Going into a midterm election year, what do each party’s electoral prospects look like? Looking at the generic ballot, voters divide. 43% say they would support the Democratic candidate in their Congressional district while 43% say they would support the Republican candidate. Six would vote for neither, and 8% are undecided.
Table: Congressional Republicans’ Approval Rating
Table: Congressional Republicans’ Approval Rating (Over Time)
Table: Congressional Democrats’ Approval Rating
Table: Congressional Democrats’ Approval Rating (Over Time)
Table: 2014 Congressional Elections
Washington Leaders Receive Poor Grades from Americans
Overall, how do Americans grade the performances of our nation’s elected officials in Washington, D.C.? More than two-thirds of adults nationally — 68% — give them below average grades. This includes 31% who rate them with a “D” and 37% who give them an “F.” 24% grade them with a “C” while 7% give the country’s elected officials a “B.” Only 1% says they deserve an “A.”
When it comes to gridlock on the federal budget, who is to blame? Nearly half of adults nationally — 48% — say the Congressional Republicans are at fault for the gridlock on the federal budget. 37% point a finger at President Obama. 12% blame both the Republicans and the president while 3% blame neither or are unsure.
When McClatchy-Marist last reported this question in April, 48% blamed the Congressional GOP, 34% placed the responsibility on President Obama, and 11% pointed a finger at both. Seven percent blamed neither or were unsure.
Table: Grade Given to Elected Officials in Washington, D.C.
Table: Blame for Gridlock on the Federal Budget
Pessimism about the Direction of the Country at Highest Point in Two Years
About two-thirds of adults nationally — 66% — say the country is moving in the wrong direction. 30% believe it is moving in the right one, and 4% are unsure. The proportion of residents who report the country has fallen off track is the highest since November 2011 when 25% thought the nation was on the right road, and 70% believed it needed a course correction. Four percent, at the time, were unsure. When McClatchy-Marist last reported this question in July, 30% said the country was traveling in the right direction. 60% reported it was moving in the wrong one, and 11% were unsure.
Table: Right or Wrong Direction of the Country
Table: Right or Wrong Direction of the Country (Over Time)

