September 24, 2010
9/24: Cuomo Leads Paladino Among Likely Voters
In the race for New York governor, Democrat Andrew Cuomo receives the support of 52% of likely voters statewide compared with 33% for Republican Carl Paladino. Rick Lazio, on the Conservative line, garners the support of 9% of likely voters. 6% are unsure.
Click Here for Complete September 24, 2010 NYS Poll Results and Tables
Not surprisingly, Cuomo receives the backing of 81% of Democratic voters who are likely to cast their ballot on Election Day. However, he is also buoyed by a notable proportion of likely Republican voters — 19%. Paladino garners the support of more than six in ten Republicans who are likely to vote — 63%, but only 11% of likely Democratic voters. Looking at likely voters who are not enrolled in any party, Cuomo receives 44% to 33% who plan to cast their ballot for Paladino. Lazio receives the support of 14% of likely non-enrolled voters, 11% of the likely Republican vote, and 4% of Democrats who are likely to vote.
Many likely voters who consider themselves supporters of the Tea Party back Paladino. 69% report this to be the case while 14% back Lazio, and 13% support Cuomo. 4% are unsure.
“Andrew Cuomo is ahead, and right now, this is not a close race,” says Dr. Lee M. Miringoff, Director of The Marist College Institute for Public Opinion. “He is being bolstered by the Lazio factor, but he is just above 50% among likely voters, and you can’t overlook the enthusiasm Republicans are bringing to this election cycle.”
Regionally, Cuomo runs best in New York City followed by the New York City suburbs. In the Big Apple, 65% of likely voters say they plan to vote for Cuomo while 23% report they will cast their ballot for Paladino. Lazio receives the support of just 6%. Moving to the suburbs, Cuomo garners a majority of likely voters in this region — 52% — while Paladino and Lazio net 30% and 16%, respectively. Upstate, Cuomo and Paladino receive the same support. Both Cuomo and Paladino take 43% of likely upstate voters. Just 7% of likely upstate voters say they will cast their ballot for Lazio. 7% are also unsure.
When likely voters who are undecided yet leaning toward a candidate are thrown into the mix, Cuomo receives 53% of the vote compared with Paladino’s 34%. Lazio takes 10%, and 3% remain unsure.
Looking at the overall electorate, 55% of registered voters statewide support Cuomo while 29% say they back Paladino. Lazio receives the nod from just 10% of New York registered voters. 6% are unsure.
Table: NY Gubernatorial Tossup (Likely Voters)
Table: NY Gubernatorial Tossup (Likely Voters Including Leaners)
Table: NY Gubernatorial Tossup (Registered Voters)
Cuomo and Paladino with Strong Support
Nearly six in ten likely voters — 59% — report they strongly support their choice for governor while more than one-fourth — 28% — somewhat support their candidate. 12% say they might vote differently.
Among likely voters who report they will back Andrew Cuomo for governor, 64% state they strongly support him, and 25% say they somewhat support him. 10%, on the other hand, might vote differently come Election Day.
Paladino’s supporters share a similar level of support. Looking at likely voters who support Paladino, 61% firmly back him, and 32% somewhat support him. 7% might change their minds and vote differently.
Rick Lazio’s supporters aren’t as intense in their level of support. Only 30% of likely voters who support Lazio report they are unwavering in their support while 28% are somewhat behind him. 40% may alter their decision before Election Day and choose another candidate.
Table: Candidates’ Strength of Support (Likely Voters)
Table: Candidates’ Strength of Support (Registered Voters)
About Two-thirds For Candidate
When asked whether they selected their respective candidate because they are for him or against his opponents, 66% of likely voters say they are for their respective candidate while 32% report they are against the others. 2% are unsure.
While more than seven in ten Cuomo supporters — 72% — choose him because they are for him, more than a quarter of his backers — 26% — say they support Cuomo because they are against Paladino and Lazio. When compared with Cuomo supporters, fewer Paladino backers report they are voting for their candidate rather than against the other candidates for governor. 58% say they are for Paladino while 39% support him because they don’t want Cuomo or Lazio to win. Although a majority of likely voters who plan to support Lazio — 53% — are backing him because they think he is the best candidate, 45% are doing so because they are against his opponents.
Table: Voting for Candidate or Against Opponents? (Likely Voters)
Table: Voting for Candidate or Against Opponents? (Registered Voters)
The Enthusiasm Factor: Majority of Republicans Express Highest Enthusiasm
Are registered voters in New York State enthusiastic about voting this November? 38% report they are very enthusiastic.
Republicans are expressing more enthusiasm about casting their ballot this fall than are Democrats. 51% of registered Republican voters say they are very enthusiastic. This compares with 34% of Democratic voters and 31% of non-enrolled voters who report the same.
Among registered voters who back Paladino — 58% — are very enthusiastic . This compares with 30% of Cuomo’s supporters and 32% of Lazio’s backers who share this degree of excitement.
Voters Dissatisfied with Albany … Want a New Direction for the State
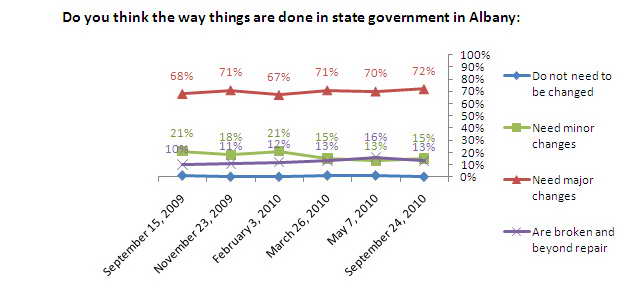
Voters are displeased with the way state government in Albany is run. More than seven in ten registered voters statewide — 72% — believe the way things are run need major changes while 13% think state government is broken and beyond repair. 15% are more forgiving and report that state government’s modus operandi needs minor changes. Less than 1% of the electorate say no changes are needed.
Little has changed on this question since Marist last asked it in May. At that time, seven in ten voters — 70% — believed major changes were needed in Albany, and 16% said Albany was beyond repair. 13% thought minor changes needed to be applied, and 1% stated all was well with how Albany was being run.
With voters expressing such a high level of dissatisfaction with state government, it’s probably little surprise that 73% of registered voters think the state needs to be re-directed. 24%, however, believe New York is moving in the right direction. 3% are unsure.
When Marist last asked voters in New York about the direction of the state, a similar proportion — 72% — thought the state needed a new course while 22% said it was on the right path. 6%, at the time, were unsure.
Table: Status of State Government in Albany
Table: Status of State Government in Albany Over Time
Table: NYS Direction
Table: NYS Direction Over Time
Out with the Old… Approval Rating for Paterson Stands at 19%
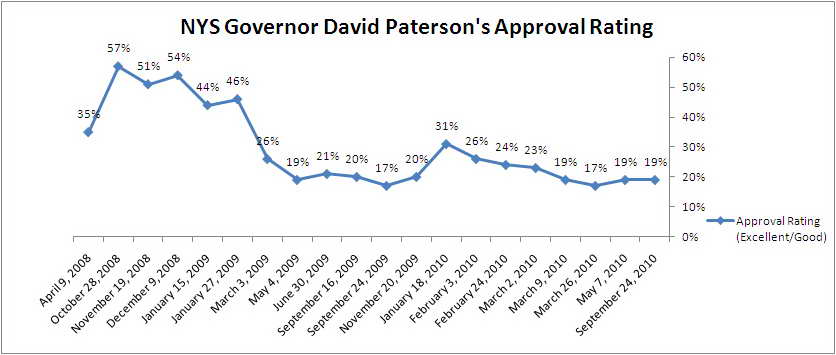
Voters’ disapproval of Governor David Paterson remains evident. Currently, about one-fifth of registered voters in New York State — 19% — think Paterson is doing either an excellent or good job in office. This includes 3% who report he is doing an excellent job and 16% who say he is doing a good one. 40% rate the job Paterson is doing as governor as fair while the same proportion — 40% — think he is performing poorly. 1% are unsure.
In Marist’s May survey, 19% gave Paterson high marks, and 38% rated his job performance as fair. About four in ten — 41% — rated Paterson poorly. 2% were unsure.
Table: Paterson Approval Rating
Table: Paterson Approval Rating Over Time
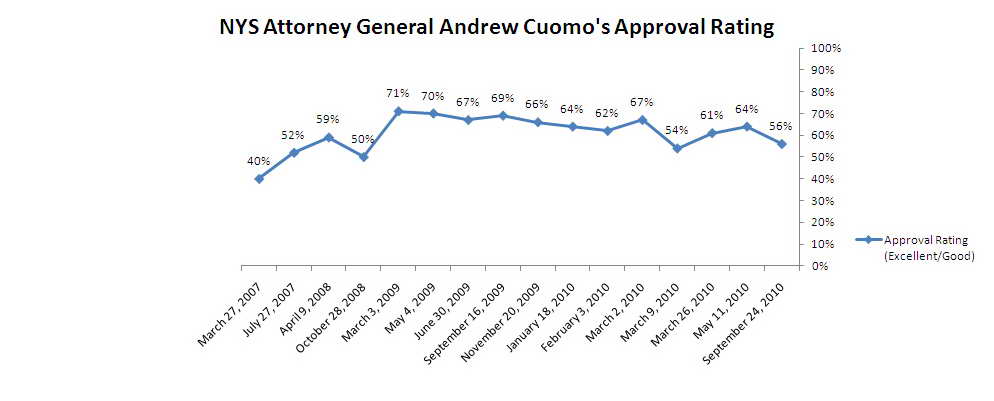
Dip In Cuomo Approval Rating
There has been a decline in New York State Attorney General Andrew Cuomo’s job approval rating due to a drop in the proportions of registered Republican voters and non-enrolled voters who now approve of his performance in office.
Among registered voters, 56% say Cuomo is doing either an excellent or good job in office. Included here are 18% who think he is doing an excellent job and 38% who believe he is doing a good one. 29% rate Cuomo as fair while just 13% call his performance poor. 2% are unsure.
In Marist’s May survey, 64% gave Cuomo a thumbs-up, 27% said he was doing a fair job, and only 6% thought he performed poorly. 3% were unsure.
While Cuomo’s Democratic base is firm, fewer Republicans and non-enrolled voters give him a thumbs-up. 36% of Republican voters and 55% of non-enrolled voters currently think Cuomo is doing either an excellent or good job in office. This compares with 58% and 63%, respectively, who thought so in May. 70% of Democrats now give Cuomo high marks while the same proportion — 70% — did so four months ago.
Table: Cuomo Approval Rating
Table: Cuomo Approval Rating Over Time
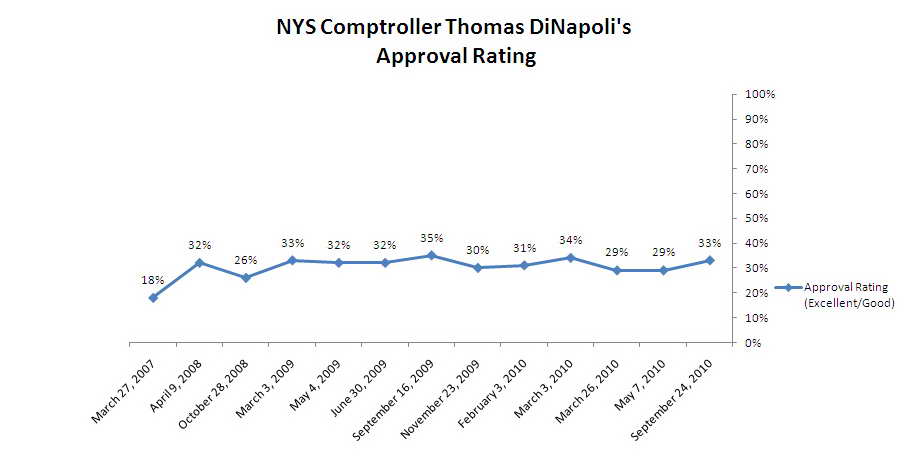
Status Quo for Comptroller DiNapoli
About one-third of registered voters statewide — 33% — think New York State Comptroller Tom DiNapoli is doing either an excellent or good job in office. Included here are 4% who say DiNapoli is doing an excellent job and 29% who believe he is doing a good job. 33% report he is doing a fair job while 13% think he is performing poorly. A notable proportion of voters — 21% — have either never heard of him or are unsure how to rate DiNapoli.
When Marist last asked New York State voters about Tom DiNapoli’s job performance, 29% gave the comptroller high marks, 34% rated his performance as fair, and 9% thought he was doing a poor job. More than one-fourth — 28% — were unsure how to rate him.
Table: DiNapoli Approval Rating
Table: DiNapoli Approval Rating Over Time
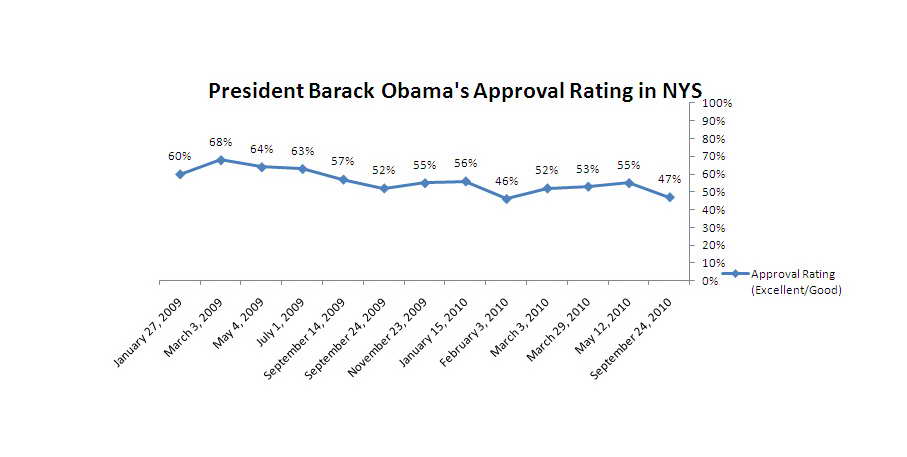
Obama Approval Rating Falls to 47%
President Barack Obama’s approval rating has dropped in New York State. Currently, 47% of registered voters in the state say the president is doing either an excellent or good job in office. This includes 16% who report Mr. Obama is doing an excellent job and 31% who think he is doing a good job. 22% say the president’s job performance is fair while 31% believe he is performing poorly. Fewer than 1% are unsure.
In Marist’s May survey, a majority — 55% — approved of how the president was doing in office while 22% rated his job performance as fair. 23% reported he was doing a subpar job. Fewer than 1% were unsure.
The change has occurred among Republicans and non-enrolled voters. While 17% of Republicans and 41% of voters not enrolled in any party currently believe the president is doing either an excellent or good job in office, 29% of the statewide GOP and a majority of non-enrolled voters — 52% — said the same four months ago.
Table: Obama Approval Rating
Table: Obama Approval Rating Over Time


