September 22, 2010
9/22: GOP Over Dems on Enthusiasm for Midterm Elections
According to this McClatchy-Marist Poll, about one-third of registered voters nationwide — 33% — report they are very enthusiastic about casting their ballot this November.
 Click Here for Complete September 22, 2010 USA McClatchy-Marist Poll Results and Tables
Republican voters are more excited about their vote than are Democratic voters. 46% of Republican voters compared with 30% of Democrats are very enthusiastic about voting in the upcoming midterm elections. 23% of independent voters also express a high level of enthusiasm.
“This is what the campaign strategists are calculating. GOPers want to reinforce the gap in enthusiasm. The White House wants to close it,” says Dr. Lee M. Miringoff, Director of The Marist College Institute for Public Opinion. “If it remains this large through the November elections, hold onto your hats when it comes to the makeup of the next Congress.”
The oldest members of the national electorate are more enthusiastic than the youngest members. 43% of voters 60 and older, compared with 16% of those younger than 30, are very enthusiastic about casting their ballot in November.
Electorate Divides Over GOP Control of Congress
Do voters want control of Congress to be passed from the Democrats to the Republicans? 48% do, 46% do not, and 6% are unsure.
Not surprisingly, opinions divide along party lines with most Republican voters — 92% — saying they want their party to have control of Congress. 87% of Democrats do not. Independent voters divide. 43% of this all-important voting block want the GOP to gain control of the legislative branch of government while 44% do not. 12% are unsure.
More than three in ten members of the overall electorate — 31% — feel strongly that control of Congress should pass to the Republicans while 17% just think the GOP should win control. On the other hand, 23% of registered voters feel strongly that Republicans should not win control of the House and Senate while the same proportion — 23% — just don’t want them to gain a majority. 6% are unsure.
Republicans express more political passion here. Two-thirds of registered Republican voters — 67% — feel strongly about the GOP winning control while 37% of Democrats feel strongly that Republicans should not win control. Looking at independent voters, 24% are adamant that the Republicans take the reigns while 28% are strongly against the idea.
Table: GOP Control of Congress
Table: Intensity of Opinion About GOP Control of Congress
Republican or Democrat? Voters Divide Over Congressional Elections
Neither Democratic candidates nor Republican candidates have the edge in voters’ minds. When asked which party’s candidate they are more likely to support in November’s midterm elections, 47% report they would back the Republican while 45% say they would back the Democrat. 3% say they would vote for neither the Democrat nor the Republican, and 5% are unsure.
However, 61% of voters who are very enthusiastic about voting this November say they are more likely to vote for the Republican candidate while 34% of those who express a high level of excitement are more likely to vote for the Democratic candidate.
There’s little surprise that 92% of Republican voters say they plan to support the Republican candidate, and 90% of Democratic voters report they will vote for the Democratic candidate. When it comes to independent voters, a plurality — 46% — think they will back the Republican candidate while 38% believe they will support the Democratic candidate.
Table: Support of Party’s Candidate
Anti-Incumbent Sentiment?
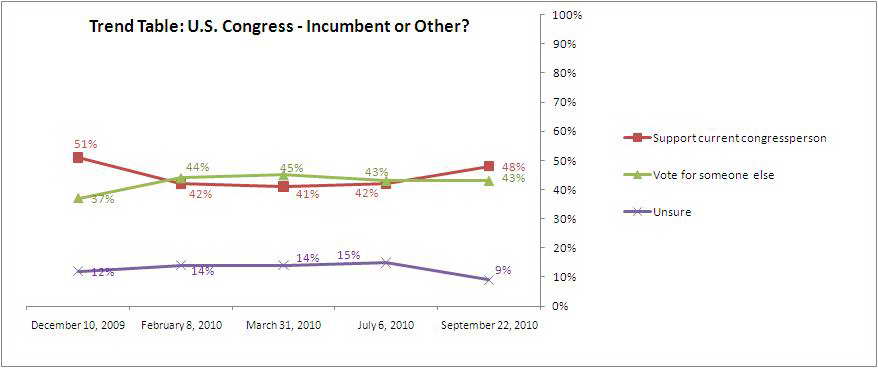
There has been a bump in the proportion of registered voters who say they will vote for their incumbent this November. 48% report they will cast their ballot for their current elected official compared with 43% who say they will vote for someone else. 9% are unsure.
When Marist last asked this question in its July survey, voters divided. 43% thought they would vote for someone else while 42% said they would support their incumbent. 15%, at that time, were unsure.
While there is a partisan divide on this question, the proportion of Republican voters who say they will vote for their current elected official has increased. 44% say they will cast their ballot for the incumbent while 49% report they will vote for someone else. 7% are unsure. When Marist last asked this question, 34% of Republicans wanted their incumbent, and a majority — 52% — wanted to seat a fresh face. 14% were unsure.
The proportion of independent voters who want to maintain the status quo has also increased. 43% support their incumbent while 47% want to elect someone new. 9% are unsure. In Marist’s July survey, 36% backed their current elected official while 49% wanted a change. 14% were unsure.
Little has changed among Democratic voters. 57% want to keep their incumbent in office while 32% want someone else. 10% are unsure. In July, 55% backed their current official, 29% wanted to bring someone new into office, and 16% were unsure.
Table: U.S. Congress – Incumbent or Other?
Table: U.S. Congress – Incumbent or Other? (Over Time)
Tea Party Revolution? About a Third of Voters Support the Movement
Talk of the Tea Party dominates news headlines. But, does the average voter support the movement? Although a majority of voters nationally — 55% — do not support the Tea Party movement, a notable 34% do. This includes 11% who strongly support the movement and 23% who just support it.
How much support does the Tea Party have among the GOP? A majority of Republicans — 56% — share allegiance. Included here are 22% who strongly support it and 34% who support it. About one-third — 33% — do not support the Tea Party. Looking at Democratic voters, 76% do not back the movement. Independent voters who back the Tea Party are also in the minority. 34% of independent voters support the Tea Party with 10% strongly supporting it and 24% supporting it. A majority of independent voters — 55% — do not support it.
Chart a New Course, Say Residents
A majority of Americans — 56% — think the nation is headed in the wrong direction while 41% believe it is on the right track. 3% are unsure. There has been little change in the proportion of Americans who say the nation’s compass is broken. When Marist last asked this question in July, 56% reported the country was moving along the wrong course compared with 37% who agreed with the trajectory of the nation. 7% were unsure.
Table: Right or Wrong Direction of the Country
Lee Miringoff discusses the midterm elections:
Related Stories:
Poll: Obama Approval Rating at 45% … Economic Views a Factor
Interview: Carl Leubsdorf Takes Us Inside the Midterms
Interview: Bonnie Angelo Discusses the Political Climate Leading Up To the Midterm Elections


