September 20, 2011
9/20: 39% Approval Rating for Obama, Lowest of Presidency
President Barack Obama faces a litany of bad news. The president’s job approval rating, his favorability, and his rating on the economy have hit all-time lows. To compound matters, three in four Americans still believe the nation is in a recession and the proportion who thinks the country is moving in the wrong direction is at its highest point in more than a decade.
Click Here for Complete September 20th, 2011 USA McClatchy-Marist Poll Release and Tables
According to this McClatchy-Marist Poll, the president’s approval rating is at 39% among registered voters nationally, an all-time low for Mr. Obama. For the first time a majority — 52% — disapproves of the job he is doing in office, and 9% are unsure.
“President Obama needs to reboot his presidency,” says Dr. Lee M. Miringoff, Director of The Marist College Institute for Public Opinion. “Although numbers like these typically spell doom for an incumbent’s re-election prospects, the Republicans in Congress and eventually his GOP opponent could still provide Obama with running room.”
President Obama’s current approval rating is his lowest since last December when 42% of voters thought his performance fell short. When McClatchy-Marist last reported this question in its August 9th survey, voters divided about how the president was performing in office. 44% of the national electorate approved while 46% disapproved. 10%, at the time, were unsure.
By party:
- 32% of independent voters now approve of the president’s job performance, 57% disapprove, and 11% are unsure. Last month, 38% of independents thought highly of the president’s performance, 46% disapproved of it, and 16% were unsure.
- 71% of Democrats approve of Mr. Obama’s job performance while 74% did so in McClatchy-Marist’s previous survey.
- Among Republicans, most voters still disapprove of how the president is doing in his post. 87% have this view now compared with 83% who did so last month.
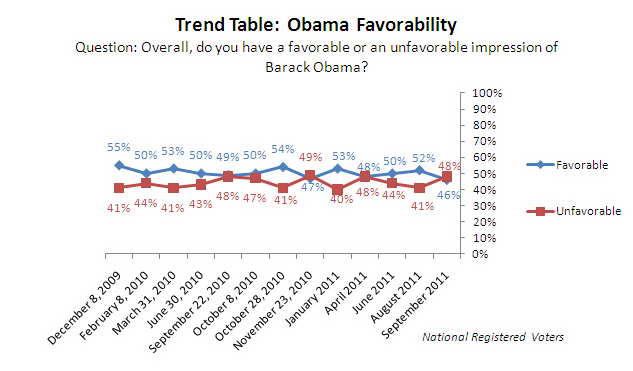
Fewer voters now have a favorable impression of President Obama. 46% view him favorably while 48% perceive him unfavorably. Five percent are unsure. President Obama’s current favorability rating is his lowest since taking office. His previous low occurred last November when 47% of the electorate thought well of him.
In McClatchy-Marist’s August survey, a slim majority — 52% — felt positively about the president while 41% had a less than stellar view of him. Eight percent, at the time, were unsure.
By party:
- There has been a ten percentage point change among independent voters and Republican voters. 40% of independent voters have a favorable impression of the president while 50% shared this view last month. Among Republican voters, 87% have an unfavorable view of Mr. Obama while 77% thought this way in August.
- There has been little change among Democratic voters. 80% think well of the president compared with 78% in McClatchy-Marist’s previous survey.
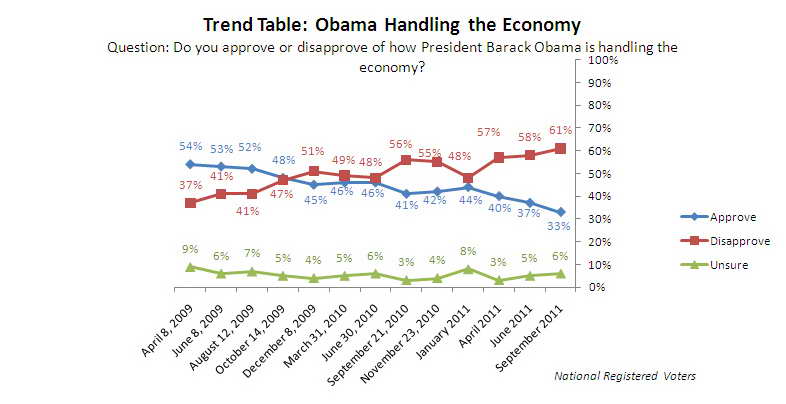
Do voters approve of how the president is handling the economy? Just 33% of registered voters approve of how he is dealing with the nation’s tumultuous financial situation while more than six in ten — 61% — disapprove. Six percent are unsure.
When McClatchy-Marist last reported this question in June, 37% approved of the president’s approach, 58% disapproved, and 5% were unsure.
By party:
- 69% of independent voters disapprove of how the president is handling the country’s economy. In June, 60% had this view.
- Among Democrats, 58% give the president high marks on his handling of the economy. 63% did so three months ago.
- Looking at Republicans, there has been no change. Most — 91% — disapprove of how the president is tackling the economy. The same proportion — 91% — had this opinion in June.
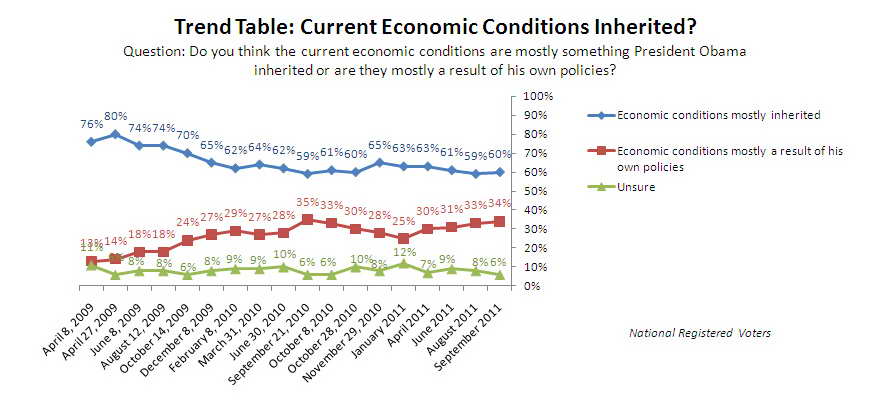
However, many voters still don’t believe the president is responsible for the nation’s current economic climate. Six in ten — 60% — think Mr. Obama inherited the current economic conditions while 34% report they are a result of his own policies. Six percent are unsure.
In McClatchy-Marist’s August survey, 59% thought President Obama was handed the nation’s economic crisis while 33% said his policies contributed to them. Eight percent, at the time, were unsure.
Key points:
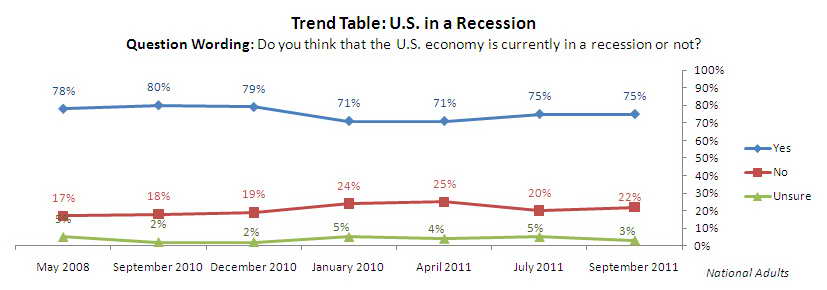
- Three in four Americans — 75% — think the country is in a recession, 22% do not, and 3% are unsure. There has been little change on this question since July when 75%, 20%, and 5%, respectively, had these views.
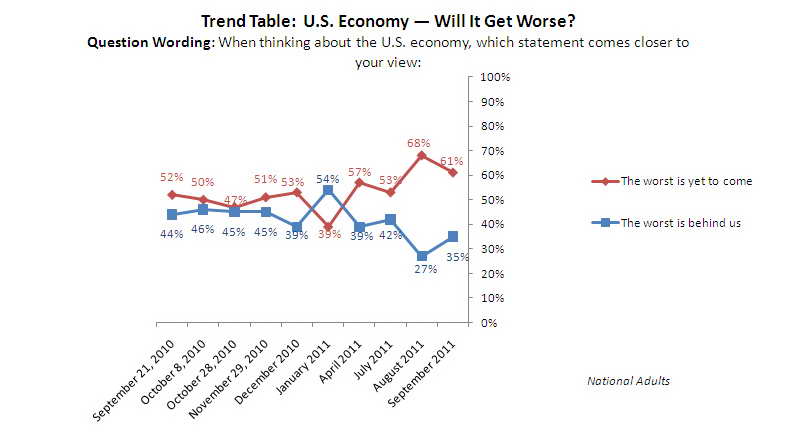
- 61% of Americans say that, when thinking about the future of the U.S. economy, the worst is still to come. This is down from 68% last month. 35% currently believe the worst is behind us, and 3% are unsure. In August, the proportions stood at 27% and 6%, respectively.
o Among registered voters, 61% report the worst is yet to come, 37% believe the worst is over, and 2% are unsure.
— Democrats have flipped on this question. A majority of Democrats — 56% — say brighter economic days are ahead. Last month, the opposite was the case. At that time, a majority — 57% — reported the worst was still ahead.
— Fewer independent voters are pessimistic. 66% say there is more bad economic news to come, down slightly from 71% in August.
— 78% of GOP voters say there are more hard times on the economic front. 75% held this opinion last month.
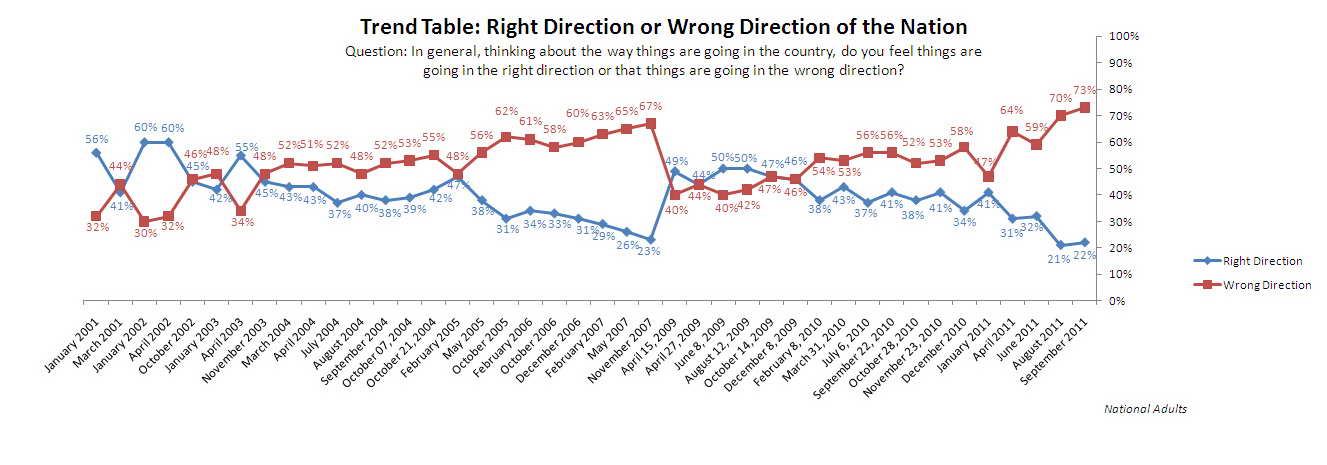
Overall, Americans are pessimistic about the direction of the country. 73% say the nation is headed in the wrong direction, 22% believe it is moving in the right one, and 5% are unsure. This is the highest proportion of Americans in more than a decade to think the nation needs its course corrected. Last month, 70% of the population reported America was on the wrong track, 21% said it was on the right one, and 10% were unsure.
Table: President Obama Approval Rating
Table: President Obama Approval Rating (Over Time)
Table: President Obama Favorability
Table: President Obama Favorability (Over Time)
Table: President Obama’s Handling of the Economy
Table: President Obama’s Handling of the Economy (Over Time)
Table: Current Economic Conditions Inherited
Table: Current Economic Conditions Inherited Over Time
Table: U.S. in a Recession Over Time
Table: U.S. Economy — Will It Get Worse?
Table: U.S. Economy — Will It Get Worse? (Over Time)
Table: Right or Wrong Direction of the Country
Table: Right or Wrong Direction of the Country (Over Time)
Obama’s Jobs Plan Doesn’t Go Far Enough, Say More Than Six in Ten Americans
More than three quarters of U.S. residents — 77% — doubt unemployment will improve in the next year. Although a slim majority of Americans — 51% — believes President Barack Obama’s proposal to create jobs will do more good than harm, more than six in ten residents nationally — 63% — don’t believe the president’s proposal goes far enough to improve the nation’s jobs picture. 71% want the Republicans in Congress to either pass the president’s proposed jobs plan or push the bill through with revisions.
Key points:
- 63% of U.S. residents think the president’s jobs plan does not go far enough, 18% say it goes too far, and 19% are unsure.
o Among registered voters:
— 78% of Democrats and 59% of independent voters think the proposal does not go far enough. Even a majority of Republicans — 54% — believes the president’s plan should do more.
- Only 23% of residents think unemployment will be lower this time next year. 77% think it will either increase or stay about the same as it is now. This includes 32% who report it will be higher and 45% who believe there will be no change.
o Among registered voters:
— 23% of voters say unemployment will be lower. 31% think it will be higher, and 46% believe it will be the same as it is now.
— Twice as many Democrats than Republicans — 17% — or independents — 17% — believe unemployment will decline in the next year. However, even among Democrats, only 35% think that will be the case.
- 51% of American adults think Mr. Obama’s plan will do more good than harm. 38% report it will do more harm than good, and only 1% says it will not make a difference. 11% are unsure.
o Among registered voters:
— Half of voters — 50% — believe the president’s plan to create more jobs will do more good than harm. 39% say it will do more harm than good, and 1% thinks it will not make a difference. Nine percent are unsure.
— Independent voters are less decisive on this question. 45% say the plan will have more of a positive effect while 40% think it will have more of a negative one.
— Not surprisingly, 82% of Democrats report the president’s plan will do more good while 74% of Republicans believe it will do more harm.
- Most Americans want the Republicans in Congress to pass President Obama’s jobs creation plan in some form. Nearly four in ten U.S. residents — 38% — want them to push the plan through as it stands. 33% want it passed with revisions, and 20% do not want them to pass President Obama’s proposal at all. Nine percent are unsure.
o Looking at registered voters:
— 37% of registered voters want the Republicans in Congress to pass the president’s plan in its current form. 34% call for its passage with revisions, and 21% do not want it passed. Eight percent are unsure.
— Nearly six in ten Democrats — 59% — want the jobs creation bill passed in its present form.
— Republicans divide. 41% think the Congressional GOP should pass the bill with amendments while 40% don’t want the bill passed at all.
— There is less of a consensus among independent voters. 39% want the Republicans to pass it with revisions, 35% want the president’s jobs plan to be passed as it was proposed, but only 18% do not want it passed at all.
- Eight percent of adults nationally say they have already contacted their representative in Congress about President Obama’s jobs plan while 9% say it is very likely they will do the same. 14% believe it is likely they will reach out to their representative, 30% say it is not very likely, and 38% report it is not likely at all they will contact their representative about President Obama’s proposal.
- 45% of U.S. residents trust the president more to create jobs while 41% place more faith in the Republicans in Congress. 14% are unsure.
o Among registered voters:
— 46% of the electorate has more trust in the president to turn the jobs picture around while 41% have more confidence in the Republicans in Congress. 13% are unsure.
— Democrats — 80% — align more with the president on this question while Republicans — 78% — align more with the Republicans in Congress. Independent voters divide. 41% trust Congressional Republicans to create more jobs while 39% put their faith in President Obama. A notable 20% are unsure.
Table: Does President Obama’s Jobs Plan Go Too Far or Not Far Enough?
Table: The Status of Unemployment Next Year
Table: Impact of President Obama’s Proposal to Create Jobs
Table: Should Republicans in Congress Pass President Obama’s Jobs Plan?
Table: Likelihood of Contacting Elected Official about Jobs Plan
Table: Who Do You Trust More to Create Jobs, President Obama or the Republicans in Congress?
Voters Dissatisfied with Congress’ Performance
President Obama isn’t the only one who fares poorly in the court of public opinion. Many registered voters aren’t happy with the job performances of the Republicans or Democrats in Congress.
Key points:
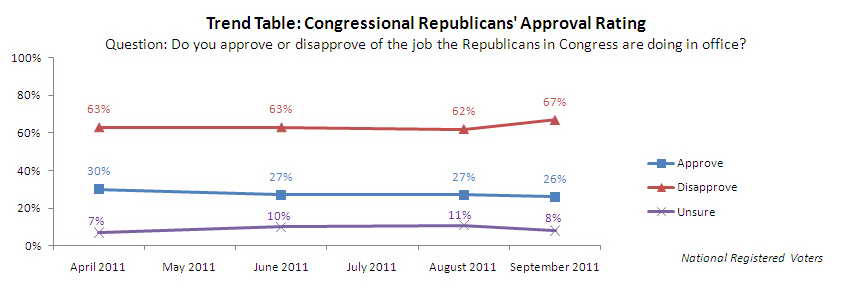
- About two-thirds of voters — 67% — disapprove of how the Republicans in Congress are doing in office. 26% approve, and 8% are unsure. There has been a slight bump in the proportion of voters who are dissatisfied with Congressional Republicans. Last month, 62% disapproved of their performance, 27% approved, and 11% were unsure.
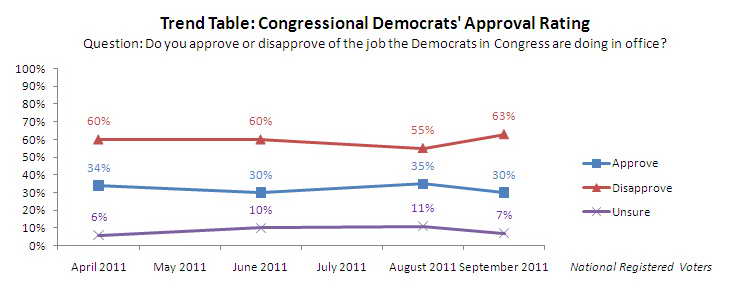
- There is also increased displeasure with the Democrats in Congress. Currently, more than six in ten registered voters nationally — 63% — disapprove of how these elected officials are doing in office while 30% approve. Only 7% are unsure. In August, 55% gave these Democrats a thumbs-down while 35% applauded their performance. 11%, at the time, were unsure.
By party:
- Independent voters also play a key role here.
o There has also been an increase in the proportion of independents who disapprove of how Republicans are performing in Congress. 71% currently disapprove while 64% thought this way last month.
o 71% of independent voters disapprove of the job of Congressional Democrats. In August, 59% shared this opinion.
- Even 43% of Republicans disapprove of how members of their own party are performing on Capitol Hill.
- Among Democrats, about one-third — 33% — shake their heads in disapproval at their fellow Democrats in Congress.
Table: Congressional Republicans’ Approval Rating
Table: Congressional Republicans’ Approval Rating (Over Time)
Table: Congressional Democrats’ Approval Rating
Table: Congressional Democrats’ Approval Rating (Over Time)
Split Decision on Obama’s Ideology
45% of registered voters believe the president’s ideology is about right while 41% say he is too liberal. Seven percent believe he is too conservative, and 6% are unsure. In McClatchy-Marist’s August survey, 48% thought the president was positioned about right ideologically. 36% saw him as too liberal, 7% believed him to be too conservative, and 8% were unsure.
More voters, however, still think the president is positioned about right ideologically than either the Republicans or Democrats in Congress.
By party:
- Looking at the Democrats in Congress, 34% say they are ideologically on the mark. 45% report they are too liberal, 13% perceive them as too conservative, and 8% are unsure. Last month, those proportions were 36%, 42%, 12%, and 10%, respectively.
- Looking at Congressional Republicans, 32% of voters view them as ideologically about right. 44% say they are too conservative, and 16% believe they are too liberal. Eight percent are unsure. In McClatchy-Marist’s previous survey, 31% of the national electorate thought the ideology of Republican lawmakers was about right, 41% saw them as too conservative, 17% perceived them as too liberal, and 11% were unsure.
Table: President Obama’s Ideology
Table: Congressional Democrats’ Ideology


