August 2, 2011
8/2: Bloomberg’s Approval Rating Stagnates
NY1/Marist New York City Poll
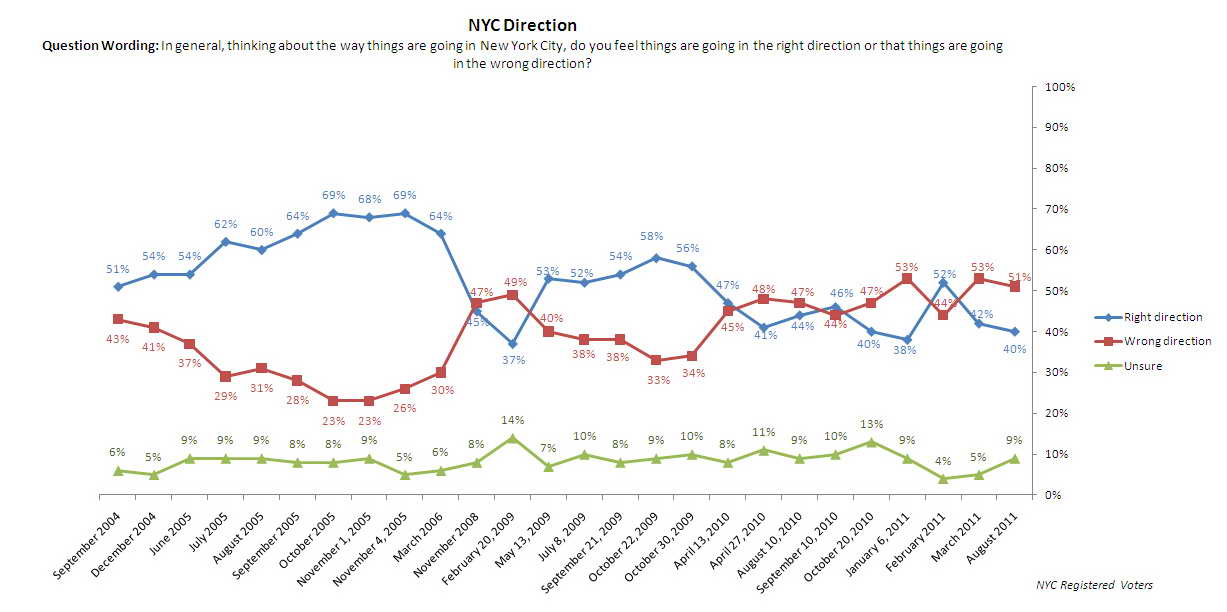
New York City Mayor Michael Bloomberg continues to struggle in the court of public opinion. Bloomberg’s job approval rating stands at 39% among registered voters citywide. And, while the mayor has improved on the issues of education and the budget, he still has a long way to go to win over the city’s electorate. A majority of voters — 54% — still disapprove of how Bloomberg is handling the city’s public schools. And, they are lukewarm about his handling of the city’s budget. Not surprisingly, 51% of voters also think New York City is headed in the wrong direction.
Click Here for Complete August 2nd, 2011 NYC NY1-Marist Poll Release and Tables
Looking at the mayor’s job approval rating, almost four in ten registered voters in New York City — 39% — give Bloomberg positive marks. This includes 8% who think Bloomberg is doing an excellent job in office and 31% who report he is doing a good one. Slightly more than one-third of voters — 35% — say he is doing a fair job while 23% believe he is performing poorly. Only 4% are unsure how to rate the mayor.
When NY1-Marist last reported Bloomberg’s job approval rating in March, 40% praised the mayor. 38% marked him as “fair,” and 21% gave Bloomberg failing grades. At that time, just 1% was unsure how to rate him.
“Roughly one and a half years into his third term as mayor, it is not surprising that New Yorkers’ views of Bloomberg’s job performance are pretty much set,” says Dr. Lee M. Miringoff, Director of The Marist College Institute for Public Opinion.
There has been little change on this question among Democrats. 37% of Democrats in New York City now think Bloomberg is doing either an excellent or good job in office. In late March, 41% held this view. Among Republicans, 39% currently give the mayor high marks. 44% shared this opinion in March. The news is somewhat better among non-enrolled voters. More non-enrolled voters now believe the mayor is doing well in office. 40% of these voters give the mayor a “thumbs-up” while 32% did so in NY1-Marist’s previous survey.
Throughout the five boroughs, Bloomberg’s job approval rating has remained mostly consistent since the previous poll. A majority of voters in Manhattan — 55% — praise Bloomberg’s time in office. In March, 59% thought this to be the case. In Queens and Staten Island, 37% approve of how the mayor is doing his job. This compares with 35% who held this view in NY1-Marist’s previous survey. 32% of those in Brooklyn applaud Bloomberg’s job performance while 35% did so a few months back. And, in the Bronx, 31% currently give Bloomberg above average marks. In March, 36% did the same.
Table: Mayor Michael Bloomberg Approval Rating
Table: Mayor Michael Bloomberg Approval Rating Over Time
Better But Not Good Grades for Bloomberg’s Handling of Schools
A majority of registered voters in New York City — 54% — disapprove of how Mayor Bloomberg is handling the city’s public schools. 36%, however, approve, and 10% are unsure. Bloomberg has improved somewhat on this issue. In NY1-Marist’s previous survey, prior to former New York City Schools Chancellor Cathie Black’s dismissal, 65% disapproved of the mayor’s approach while 27% approved. Eight percent, at the time, were unsure.
The perception of Bloomberg’s handling of education in New York City has improved regardless of political party. 41% of Republicans, 38% of non-enrolled voters, and 35% of Democrats now give the mayor a gold star when it comes to his handling of the public schools while 36%, 30%, and 24%, respectively, held these views in March.
Table: Bloomberg on Public Schools
Table: Bloomberg on Public Schools Over Time
The Great Budgetary Divide
When it comes to Bloomberg’s handling of the city’s budget, voters divide. 46% of registered voters disapprove of how the mayor is addressing the issue while 43% approve. 11% are unsure.
Mayor Bloomberg has made some inroads with voters on this issue. A majority — 56% — disapproved of the mayor’s approach in NY1-Marist’s March survey. 38%, at that time, approved, and 6% were unsure.
Democrats and non-enrolled voters are the key. 48% of Democrats and 39% of those not enrolled in any party now disapprove of how Bloomberg is handling the city’s budget. In March, 58% and 53%, respectively, shared this view. Among Republicans, a majority — 53% — are dissatisfied with Mayor Bloomberg on this issue. This compares with 47% who felt this way in March.
Table: Bloomberg on the City’s Budget
Table: Bloomberg on the City’s Budget Over Time
Direction of New York City Still Off the Track, Says Majority
A slim majority of New York City registered voters — 51% — thinks the city is moving in the wrong direction. Four in ten — 40% — believe the Big Apple is traveling along the correct path, and 9% are unsure.
Little has changed on this question since NY1-Marist’s March survey. At that time, 53% reported New York City needed a new compass while 42% said the city’s trajectory was on target. Five percent, then, were unsure.
Table: New York City Direction
Table: New York City Direction Over Time
Bloomberg’s Legacy Remains Intact
Despite Bloomberg’s mixed reviews, nearly four in ten voters — 38% — believe the mayor will be remembered positively. Included here are 10% who think he will be remembered as one of the city’s best mayors and 28% who report he will be thought of as an above average mayor. 39% say his legacy will be about average. 12% believe his name will be synonymous with a below average job, and 11% think Bloomberg will be remembered as one of the worst mayors in New York City’s history.
Perceptions of Bloomberg’s legacy remain unchanged since March. In the previous poll, 39% reported Bloomberg will leave behind a positive legacy. 37% thought the mayor’s contributions would be perceived as about average. 15% reported he would be recalled as a below average leader, and one in ten — 10% — predicted Bloomberg would be perceived as one of the city’s worst mayors.
Table: Bloomberg’s Legacy
Table: Bloomberg’s Legacy Over Time


