April 19, 2011
4/19: High Dissatisfaction with Washington
According to this McClatchy-Marist Poll, many registered voters nationwide are not pleased with how President Barack Obama is handling the federal budget deficit. And, there’s more bad news for the president. President Obama’s job approval rating is stagnating, and his favorability rating isn’t much better. Many voters also view the country as moving in the wrong direction. But, the dissatisfaction isn’t being laid only at the gates of the White House. Most voters disapprove of the job both the Democrats and Republicans are doing in Congress.
“The approval ratings for the president and Congress continue to lag as voters grow increasingly dissatisfied with Washington politics,” says Dr. Lee M. Miringoff, Director of the Marist College Institute for Public Opinion. “Voters are anxious to get things back on track, but the latest round of budget battles has been costly in the realm of public opinion.”
Voters Low on Obama’s Handling of Deficit
President Barack Obama wants to reduce the nation’s deficit by four trillion dollars over a 12 year time frame. But, are registered voters nationally confident in the president’s ability to do so?
Click Here for Complete April 19, 2011 USA McClatchy-Marist Poll Release and Tables
According to this McClatchy-Marist Poll, 61% of registered voters nationally disapprove of how the president is handling the federal budget deficit. 34% approve, and only 5% are unsure.
Republicans are the most dissatisfied with how Mr. Obama is tackling the deficit. Most GOP voters — 91% — disapprove of his approach while just 5% approve. Among independent voters, more than two-thirds — 68% — are unhappy with how the president is addressing the issue compared with 28% who approve. And, while 64% of the president’s own party approve of how Mr. Obama is dealing with the deficit, a significant 30% of Democrats would prefer he take on the issue in a different way.
President Obama laid out his plan to deal with the budget deficit last Wednesday. And, while there was a slight bounce in those who approve of how the president is handling the federal deficit after his speech, voters remain pessimistic. Prior to the president’s address at George Washington University, 31% approved of how he is dealing with the deficit compared with 38% who report the same after he outlined his plan.
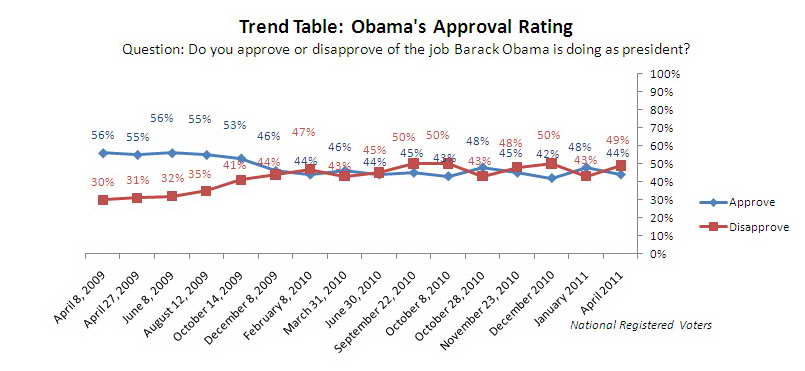
When it comes to Mr. Obama’s overall job performance, voters remain tepid. Currently, 44% of registered voters approve of how the president is doing in office compared with 49% who disapprove. Six percent are unsure.
In McClatchy-Marist’s January survey, 48% of registered voters thought the president was doing well in office while 43% believed he missed the mark. Nine percent, at the time, were unsure.
Since that previous survey, there has been an increase in the proportion of independent voters who disapprove of the president’s job performance. Currently, a slim majority — 51% — have this view compared with 44% in January.
There has been little change among Republicans. 87% now disapprove of the president’s job performance while 83% did the same in January.
And, while most Democrats — 77% — approve of the president’s job performance, there has been a slight decrease in the proportion who believe this to be the case. Three months ago, 84% of Democrats applauded the president.
Table: President Obama’s Handling of the Deficit
Table: Obama Approval Rating
Table: Obama Approval Rating (Over Time)
Dip in Obama’s Favorability
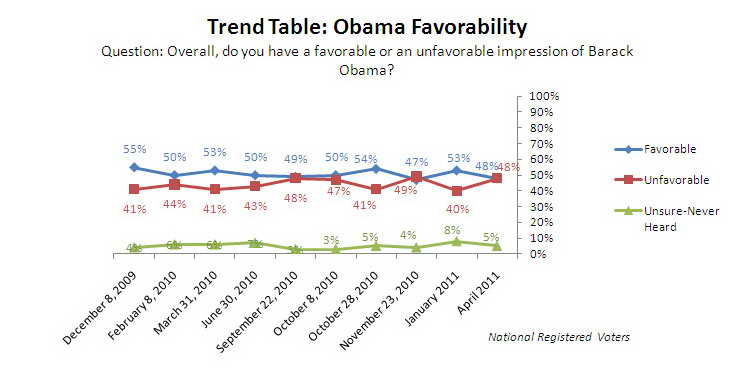
Voters nationally divide about how much they like President Obama. 48% think well of him while the same proportion — 48% — view him unfavorably. Only 5% are unsure.
When McClatchy-Marist last reported this question in January, a majority — 53% — rated Obama favorably while 40% had an unfavorable impression of him. Eight percent, at that time, were unsure.
Independents make the difference on this question. Currently, half — 50% — have a less than stellar impression of Mr. Obama while 45% perceive him positively. In January, 42% had an unfavorable impression of the president while a majority — 53% — had a favorable one.
Table: Obama Favorability
Table: Obama Favorability Over Time
Direction of Nation Takes Sharp Turn for the Worse
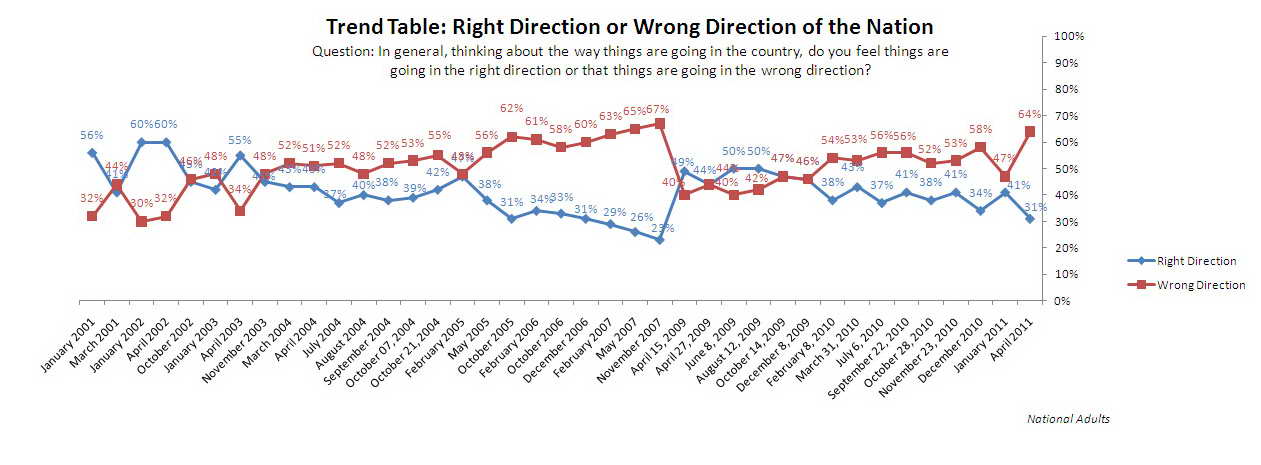
64% of Americans currently think the nation is moving in the wrong direction while just 31% believe it is moving in the right direction. Five percent are unsure. The proportion of voters who perceive the nation as moving in the wrong direction is the largest since November 2007. At that time, 67% shared this view while 23% thought the country was on track. 10% were unsure.
When McClatchy-Marist last reported this question in January, 47% thought the nation was on the wrong path while 41% said it was on the right one. 12% were unsure.
Americans’ increased pessimism crosses party lines. The largest change has occurred among Democrats. 44% currently think the nation is moving in the wrong direction compared with 23% in January. About two-thirds of independents — 67% — now share this view while 51% previously said the same. Most members of the GOP — 82% — report the nation needs to have its course redirected while 72% thought that way in January.
Perceptions of the nation’s status inched up following President Obama’s April 13th speech. Prior to his address, 29% reported the country was on the right path compared with 34% following his speech.
Table: Right or Wrong Direction of the Country
Table: Right or Wrong Direction of the Country (Over Time)
Congressional Democrats and Republicans in Voters’ Doghouse
Both Democrats and Republicans in Congress need to step up their game in the eyes of voters. More than six in ten registered voters — 63% — disapprove of the job Republicans in Congress are doing. Three in ten — 30% — approve, and 7% are unsure.
While it’s not surprising that most Democrats — 81% — are dissatisfied with the job of Congressional Republicans, a notable 36% of Republicans are unhappy with how members of their own party are doing on Capitol Hill. About two-thirds of independent voters — 67% — disapprove of Congressional Republicans’ job performance.
It’s a similar story for Congressional Democrats. 60% of voters nationally disapprove of the job Democrats in Congress are doing while 34% approve. Only 6% are unsure.
Here, most Republicans — 91% — disapprove of how Democratic members of Congress are carrying out their responsibilities. A notable 33% of Democrats and more than six in ten independent voters — 62% — share this view.
Table: Congressional Republicans’ Approval Rating
Table: Congressional Democrats’ Approval Rating
Reducing Deficit Should Be Top Priority of Congress, Say Voters
Voters want the deficit to be Congress’ main priority. Nearly six in ten voters — 57% — believe Congress should focus on reducing the deficit. 27% report maintaining services and benefits should be the priority of Congress. 14% say cutting taxes should top their “to do” list, and just 2% are unsure.
Little has changed on this question since January. At that time, 53% thought slashing the deficit should be Congress’ main concern while 23% believed their attention should be directed to maintaining services and benefits. Nearly one in five voters — 19% — wanted Congress to concentrate on cutting taxes. Five percent, at the time, were unsure.
Table: Congress’ Top Priority
Table: Congress’ Top Priority (Over Time)
Dealing with the Deficit: Voters Weigh the Options
Voters may want Congress to focus on the deficit, but there are certain tradeoffs American voters are and are not willing to make to deal with the federal budget deficit.
- Most voters — 80% — oppose cutting Medicare and Medicaid spending. While most Democrats — 92% — and three in four independent voters — 75% — are against slashing spending on these programs, even more than seven in ten Republicans — 73% — agree.
- About seven in ten registered voters nationally — 69% — oppose raising the federal debt ceiling to deal with the deficit. Republicans — 79% — and independent voters — 74% — are more opposed to this measure than are Democrats — 53%.
- A majority of voters — 54% — are against reducing military spending to ease the nation’s deficit. There is a partisan divide. 65% of Republicans oppose doing so while a majority of Democrats — 53% — support such a move. A majority of independents — 53% — are against cuts to military spending to reduce the federal deficit.
- However, nearly two-thirds of voters — 64% — support increasing taxes on the wealthiest Americans, those earning $250,000 or more annually. Here too, partisan politics come into play. Democrats — 83% — and independents — 63% — are the most vocal in their support. A majority of Republicans — 54% — are opposed.
Table: Dealing with the Federal Budget Deficit — Cutting Medicare and Medicaid Spending
Table: Dealing with the Federal Budget Deficit — Raising the Debt Ceiling
Table: Dealing with the Federal Budget Deficit — Reducing Military Spending
Table: Dealing with the Federal Budget Deficit — Increase Taxes
Budget Shutdown? It Depends on the Circumstances
President Obama and Congress may have reached a tentative budget deal to prevent a government shutdown, but the budget battle is not over. Looking ahead to the next round of budget talks, would registered voters support a government shutdown? 36% would not support such an action under any circumstances. 34% would favor a shutdown if it kept Democrats from increasing the budget deficit, and 23% would support a shutdown if it prevented Republicans from cutting Medicare and Medicaid spending. Seven percent are unsure.
Looking at party, a majority of Republicans — 55% — would favor a shutdown if it stopped Democrats from increasing the deficit. There is no consensus among Democrats. While 42% would favor a shutdown if it kept the Republicans from cutting Medicare and Medicaid spending, an additional 42% would not want a shutdown under any circumstances. Among independent voters, 39% say preventing an increase to the deficit would warrant a shutdown, while 38% would not support a shutdown under any circumstances. 16% report they would favor a shutdown if it kept Republicans from cutting Medicare and Medicaid spending.


