January 25, 2012
1/25: New York Voters More Optimistic About Direction of State
NY1/YNN/Marist New York State Poll
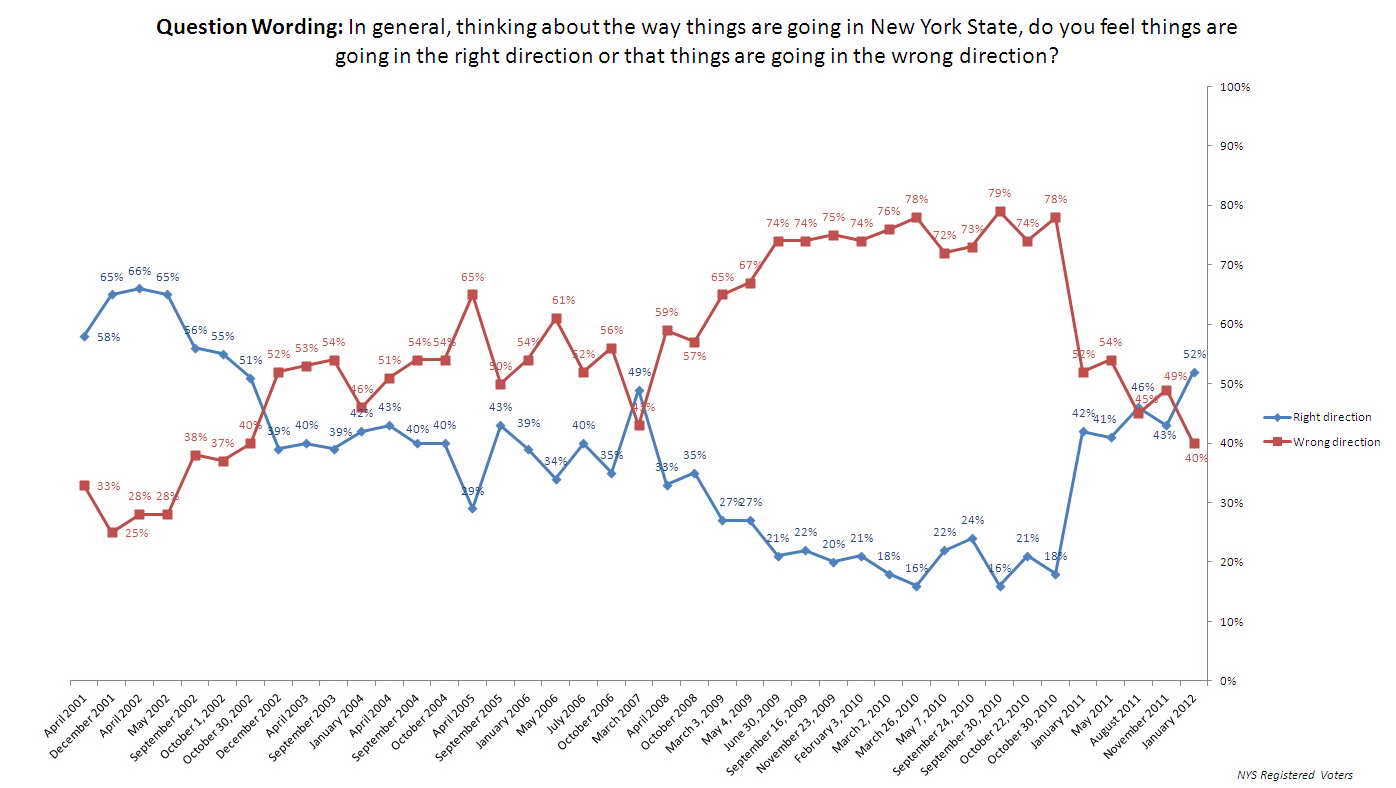
For the first time in nearly a decade, a majority of the New York electorate believes the Empire State is heading in the right direction. 52% of voters share this view while 40% believe it is moving in the wrong direction. Eight percent are unsure. The last time a majority of the electorate reported the state was on track was in October 2002 when 51% shared that view.
Click Here for Complete January 25th, 2012 NYS NY1/YNN-Marist Poll Release and Tables
When NY1/YNN-Marist last reported this question in November 2011, voters’ perceptions were quite different. 49% thought the state was travelling along the wrong path while 43% believed it was following the right one. Seven percent, at the time, were unsure.
“This represents a dramatic shift in public sentiment after a decade of frustration,” says Dr. Lee M. Miringoff, Director of The Marist College Institute for Public Opinion. “Positive reaction to Governor Cuomo is influencing how voters feel about the future of New York.”
Key points:
- A significant change has been in the proportion of Republican voters statewide who believe New York is moving in the right direction. Nearly half — 48% — currently believe this to be the case compared with 28% who had this view in November, a 20 percentage point increase. There has been little change among Democrats — 58% — and non-enrolled voters — 47%. 53% and 44%, respectively, shared these views in the last poll.
- Optimism has grown particularly in the suburbs and upstate. A majority — 56% — of voters in the suburbs of New York City, 52% of those in New York City, and half — 50% — of voters upstate now think the state is on course. This compares with 46%, 48%, and 39%, respectively, who had this opinion in November.
Table: Direction of NYS
Table: Direction of NYS (Over Time)
Nearly Six in Ten Approve of Cuomo’s Overall Job Performance
58% of registered voters in New York State approve of the job Governor Andrew Cuomo is doing in office. This includes 12% who believe he is doing an excellent job and 46% who think he is doing a good one. Almost three in ten — 29% — rate the governor’s performance as fair while 7% say he is missing the mark. Seven percent are unsure.
Governor Cuomo continues to score high marks in the realm of public opinion. In NY1/YNN-Marist’s previous survey, 55% thought Cuomo was doing an above average job while 32% believed he was doing an average one. Seven percent thought his performance was poor, and 6%, at the time, were unsure.
New York State voters also have an overall favorable impression of Governor Cuomo. 76% have this view of him while 16% have an unfavorable impression of the governor. Eight percent are unsure.
In November, 70% had a positive impression of Mr. Cuomo while 19% had a negative one. 11% were unsure.
Table: Governor Andrew Cuomo Approval Rating
Table: Governor Andrew Cuomo Approval Rating Over Time
Table: Governor Andrew Cuomo Favorability
Table: Governor Andrew Cuomo Favorability Over Time
The Keys to Cuomo’s Current Success
What accounts for Cuomo’s solid job approval rating and favorable perception? On the specifics of Cuomo’s image:
- Slightly more than three in four registered voters in New York — 76% — think Cuomo is a good leader for the state. 18% disagree, and 5% are unsure. In November, 75% believed Cuomo was a good leader.
- 68% of voters say Cuomo is changing Albany for the better, 26% report he is not, and 7% are unsure. There has been a slight increase in the proportion of voters who think Cuomo is positively impacting Albany. 63% thought this to be the case in November.
- Many voters also believe the governor is keeping his campaign promises. 65% have this view while 20% disagree, and 15% are unsure. There has been no change on this question. 65% had this opinion in NY1/YNN-Marist’s November survey.
- When it comes to Cuomo’s ideology, nearly six in ten registered voters in New York — 57% — think Cuomo is a political moderate while 21% believe he is a liberal, and 14% report he is a conservative. Nine percent are unsure. In November, slightly more voters reported Cuomo to be liberal. At that time, 53% reported he was a moderate, 27% thought he was a liberal, and 13% said he was a conservative. Eight percent were, then, unsure.
Table: Governor Andrew Cuomo as Leader
Table: Governor Andrew Cuomo as Leader Over Time
Table: Governor Andrew Cuomo’s Impact on Albany
Table: Governor Andrew Cuomo’s Impact on Albany Over Time
Table: Governor Andrew Cuomo as Fulfilling Campaign Promises
Table: Governor Andrew Cuomo as Fulfilling Campaign Promises Over Time
Table: Governor Andrew Cuomo’s Ideology
Table: Governor Andrew Cuomo’s Ideology Over Time
About Two-Thirds Approve of Cuomo’s Handling of the State’s Budget
65% of registered voters in New York approve of how Governor Andrew Cuomo is handling the state’s budget while 29% disapprove, and 6% are unsure.
Key points:
- Majorities of voters upstate — 68% — in New York City — 65% — and in the suburbs of New York City — 59% — like how the governor is dealing with the state’s budget.
On the specifics of Governor Andrew Cuomo’s budget proposal:
- 71% of registered voters statewide favor linking tougher standards for evaluating teachers to aid for school districts. 24% oppose such an action, and 5% are unsure.
- Looking at the pensions of future public employees, 69% are for increasing the amount of money these workers personally contribute to their pension. 28% are against it, and 3% are unsure.
- Nearly seven in ten registered voters — 68% — favor giving future public employees the option of an individual 401K instead of a government pension. 28% oppose it, and 4% are unsure.
- Should the retirement age for public employees be raised from 62 years old to 65? A majority of registered voters — 55% — think it should be while 43% don’t. Only 1% is unsure. There is an age difference. 62% of voters 45 years of age or older favor the increase while just 45% of those who are younger say the same.
- More than six in ten registered voters statewide — 62% — are for spending one billion dollars, including some state money, to try to revitalize business in the Buffalo area. About one in three — 33% — opposes such an action, and 5% are unsure. Regionally, upstate voters — 67% — are most likely to support this proposal, but even 60% of voters in New York City and 57% of those in the suburbs of New York City favor the idea as well.
- Voters divide about whether or not a new convention center near Aqueduct Racetrack in Queens should be built with $4 billion dollars of private funds. 47% oppose the action while 45% favor it. Seven percent are unsure. A majority of suburban voters — 56% — favor the new development while 54% of those upstate oppose it. New York City voters divide. 47% favor the action while 45% are against it.
Table: Governor Andrew Cuomo’s Handling of the New York State Budget
Table: Linking Tougher Standards for Evaluating Teachers to Aid for School Districts
Table: Increasing the Amount of Money Public Employees Personally Contribute to Their Pension
Table: Providing Future Public Employees an Option of a 401K Instead of a Government Pension
Table: Raising the Retirement Age from 62 to 65 Years Old for Public Employees
Table: Spending $1 Billion to Try to Bring Business to Buffalo
Table: Building a New Convention Center Near Aqueduct Racetrack
Dip in Support for Non-Indian Casinos in NYS
Half of New York State adults — 50% — support the allowance of commercial non-Indian casinos in New York State while 41% oppose such an action, and 9% are unsure.
There has been a decrease in support on this issue. In NY1/YNN-Marist November survey, 60% backed the idea while 35% were against it, and 5% were unsure.
There has been a similar dip in support among registered voters statewide. A slim majority — 51% — now backs the proposal while 44% oppose it, and 5% are unsure. In November, 58% were for allowing commercial non-Indian casinos in New York State compared with 37% who opposed it and 5% who were unsure.
Key points:
- Among registered voters, the sharpest decline has been among Democrats. 49% of these voters support the plan while 59% did so in November.
When it comes to the impact on jobs and revenues, 52% of New York State adults believe allowing commercial non-Indian casinos in New York State is a good way to raise revenues and create jobs while 43% think it is a bad way to do so. Five percent are unsure.
There has been a change on this question. In NY1/YNN-Marist’s previous survey, 59% said such casinos would have a positive impact on state revenues and job creation. 37% reported it would have a negative impact, and 4% were unsure.
Among registered voters, 51% think these casinos would be advantageous to the state, 45% say they would be a detriment, and 4% are unsure. Here, too, there has been a decline in support. In November, 57% thought these casinos would be beneficial, 39% said they would be a bad way to raise state revenues and create jobs, and 4% were unsure.
Key points:
- Regionally, 56% of adults living in New York City, 52% residing upstate, and 44% of those in the suburbs of New York City believe commercial non-Indian casinos in New York State would be a good way to raise revenues and create jobs. This compares with 63%, 56%, and 55%, respectively in November.
- Among registered voters, there has been a decline in the proportion of Democrats — 50% — who believe these casinos would have a positive impact. 63% shared this view two months ago.
Table: Support for non-Indian Casinos in New York State (Adults)
Table: Support for non-Indian Casinos in New York State (Registered Voters)
Table: Non-Indian Casinos are a Good or Bad Way to Raise NYS Revenues and Jobs (Adults)
Table: Non-Indian Casinos are a Good or Bad Way to Raise NYS Revenues and Jobs (Registered Voters)
Increase in NYS Senate and Assembly Approval Ratings
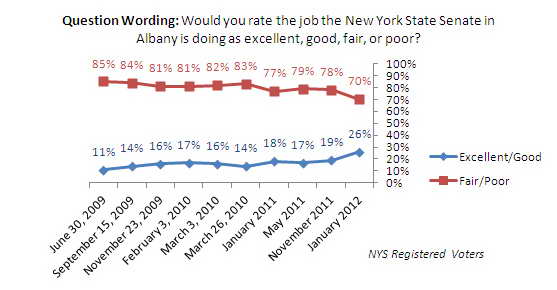
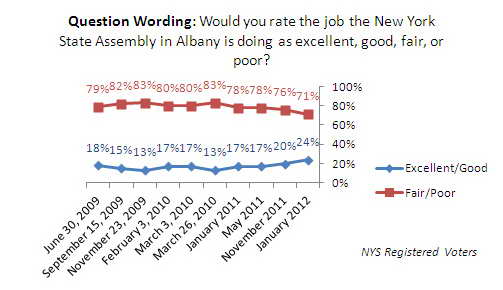
After more than two years scraping bottom, the approval ratings for both the New York State Senate and Assembly have inched up.
About one in four voters — 26% — now say that the legislative body is doing either an excellent or good job. Included here are 2% who think it is doing an excellent job and 24% who report it is doing a good one. 44% rate it as fair while 26% say it is performing poorly. Four percent are unsure.
There has been a 7 percentage point increase in the proportion of voters who rate the State Senate positively. In November, only 19% gave it high marks, 45% thought its performance was average, and 33% said it fell short. Three percent, at the time, were unsure.
Although not as marked an improvement, the approval rating of the New York State Assembly has also edged up. 24% of registered voters in New York now think this legislative body is doing either an excellent or good job in office. This includes 2% who believe the Assembly is doing an excellent job and 22% who report it is doing a good one. 42% give it fair marks while 29% say it is performing poorly. Five percent are unsure.
In NY1/YNN-Marist’s previous survey, 20% thought the State Assembly was doing an above average job, 43% said it was doing fairly well, and 33% believed it fell short. Four percent were unsure.
Table: New York State Senate Job Approval Rating
Table: New York State Senate Job Approval Rating (Over Time)
Table: New York State Assembly Job Approval Rating
Table: New York State Assembly Job Approval Rating (Over Time)


