December 12, 2012
12/12: Four in Ten with High Expectations for Obama’s 2nd Term
McClatchy/Marist National Poll
Looking ahead to President Barack Obama’s second term in office, 40% of registered voters nationally expect his second go around to be better than his first term. 30% think it will be about the same while 28% believe it will be worse. Two percent are unsure.
Click Here for Complete December 12, 2012 USA McClatchy-Marist Poll Release and Tables
“Expectations for President Obama’s second term divide along party lines; Democrats are optimistic and Republicans are not,” says Dr. Lee M. Miringoff, Director of The Marist College Institute for Public Opinion. “But, a majority of Democrats, Republicans, and independents believe the president is going to have more of a say than Congress in his second term.”
While nearly three in four Democrats nationally — 73% — believe the president’s second term will trump his first, independent voters temper their expectations. Four in ten independents — 40% — think it will be about the same as the last four years while 32% say it will be better. Not surprisingly, a majority of Republicans — 59% — report President Obama’s second term will be worse than his first four years in office.
When it comes to the president’s overall job performance, half of U.S. registered voters — 50% — approve of how he is doing in office while 44% disapprove. Six percent are unsure. This matches his approval rating just prior to his re-election, the highest rating he had achieved in more than three years. In October of 2009, 53% of voters gave the president high marks. 41% thought his performance fell short, and 6% were unsure.
When McClatchy-Marist last reported this question in July of 2012, voters divided. 47% approved of how the president was doing his job while 47% disapproved. Six percent were unsure.
But, do voters think well of the president? 53% have a favorable view of President Obama while 44% have an unfavorable impression of him. Three percent are unsure.
In July, 49% of voters had a positive view of the president while 46% had an unfavorable one. Five percent, at the time, were unsure.
Table: Will President Barack Obama’s Second Term Be Better Than the First?
Table: President Obama Approval Rating
Table: President Obama Approval Rating (Over Time)
Table: President Obama Favorability
Table: President Obama Favorability (Over Time)
Majority Approves of Obama’s Handling of Foreign Policy…Disapproves on Economy
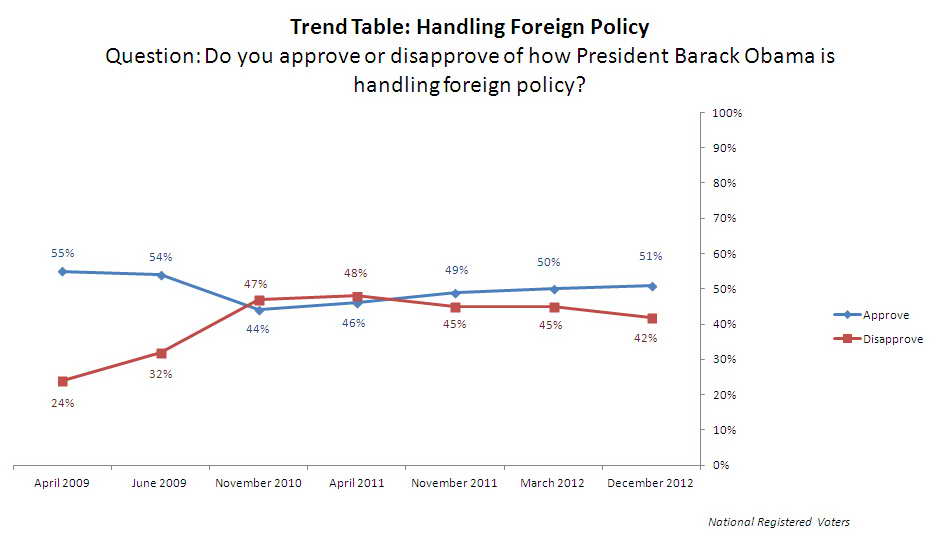
51% of registered voters approve of how President Obama is addressing foreign policy. 42% disapprove, and 7% are unsure. Little has changed on this question since McClatchy-Marist last reported it in March. At that time, 50% gave the president a thumbs-up, 45% said he fell short, and 5% were unsure.
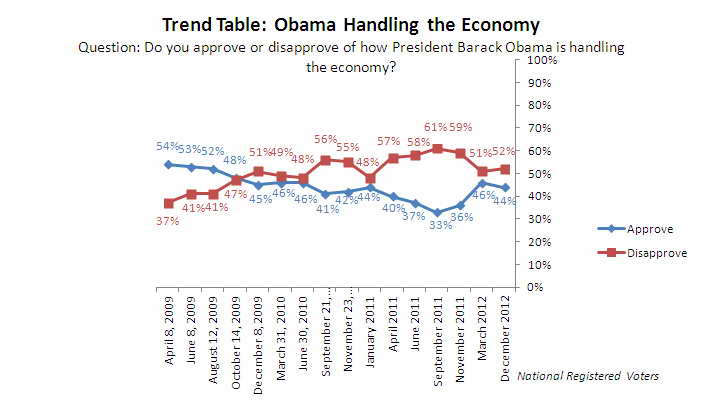
On the economy, it’s a different story. 44% of registered voters nationally approve of how the president is dealing with the economy while a majority — 52% — disapproves. Four percent are unsure. This is little changed from March when 46% gave the president high marks on the economy. 51%, then, believed he missed the mark, and 3% were unsure.
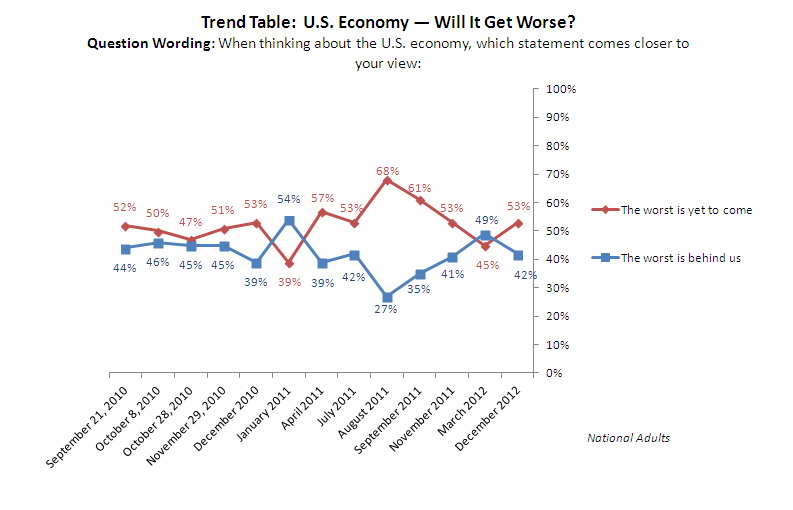
When it comes to the future of the U.S. economy, a majority of Americans — 53% — think the worst of the nation’s economic conditions are still to come while 42% say the worst is over. Five percent are unsure. In McClatchy-Marist’s March survey, 45% of adults nationally thought more bad economic news was ahead while 49% thought the nation had turned the economic corner. Six percent, then, were unsure.
On the personal side, 40% of American adults believe their financial situation will be about the same in the next year. 32%, however, think they will be worse off while 27% say they will be better off.
In December of 2008, 50% of Americans expected there to be little change in their economic situation in the coming year. This compares with 26% who thought they would be better off and 24% who said they would be worse off.
Table: Handling Foreign Policy
Table: Handling Foreign Policy Over Time
Table: President Obama’s Handling of the Economy
Table: President Obama’s Handling of the Economy (Over Time)
Table: U.S. Economy — Will It Get Worse?
Table: U.S. Economy — Will It Get Worse? (Over Time)
Table: Economically Better Off in the Next Year?
Obama in the Driver’s Seat, Say Nearly Two-Thirds
65% of registered voters nationally believe President Obama will have more of an influence over the direction of the nation in the next two years than the Republicans in Congress. However, about one in four — 26% — thinks the Republicans in Congress will hold sway while 3% report both will have an equal amount of influence. Six percent are unsure.
77% of Democrats and 61% of independents believe the president will have more input. Even a majority of Republicans — 56% — say the same.
Do Americans believe the nation is moving in the right or wrong direction? Well, it depends. Overall, a majority — 55% — thinks the nation is on the wrong path while 40% say it is on the right one. Five percent are unsure. This is little changed from McClatchy-Marist’s March survey when 53% said the country was off course. 43%, then, thought the nation was on the right track, and 4% were unsure. But, in the current survey, 70% of Democrats are positive about the country’s trajectory compared with only 9% of Republicans and 35% of independents who share this view.
Table: Right or Wrong Direction of the Country
Table: Right or Wrong Direction of the Country (Over Time)
Political Environment Conducive to Compromise?
When it comes to the degree of compromise voters expect from the president and the Republicans in Congress over the next four years, 45% think it will be about the same as it has been. 35% believe they will compromise more while 17% say they will be less willing to bend. Two percent are unsure.
While 54% of Democrats report there will be greater compromise, Republicans and independent voters are not as optimistic. Half of Republicans — 50% — and 51% of independents say the amount of compromise will change little from the first term.
Table: Amount of Compromise Over the Next Four Years
Both Democrats and Republicans Go Too Far, Say Pluralities…Congressional Approval Ratings Low
46% of registered voters nationally believe the Republican Party is too conservative. 32% believe it’s ideologically about right while 15% say it is too liberal. Seven percent are unsure.
When it comes to the Democratic Party, 47% of voters believe it is too liberal. 41% say the party’s ideology is about right, 8% think they are too conservative. Five percent are unsure.
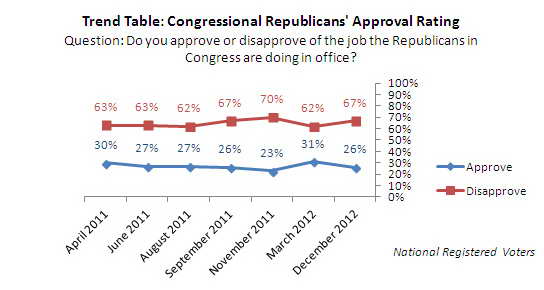
Voters remain dissatisfied with the job performance of the Republicans in Congress. 67% disapprove of how they are doing while 26% approve. Seven percent are unsure. When McClatchy-Marist last reported this question in March of 2012, 62% thought the job performance of the GOP in Congress was subpar while 31% approved of their performance. Eight percent were unsure.
Looking at the Democrats in Congress, 58% say the job they are doing currently falls short. 35% approve of how they are doing, and 7% are unsure. Six months ago, 59% gave the Democrats in Congress low marks while 34% approved of their job performance. Seven percent, then, were unsure.
Table: Republican Party Ideology
Table: Democratic Party Ideology
Table: Congressional Republicans’ Approval Rating
Table: Congressional Republicans’ Approval Rating (Over Time)
Table: Congressional Democrats’ Approval Rating
Table: Congressional Democrats’ Approval Rating (Over Time)

