October 8, 2010
10/8: Obama Approval Rating at 43%
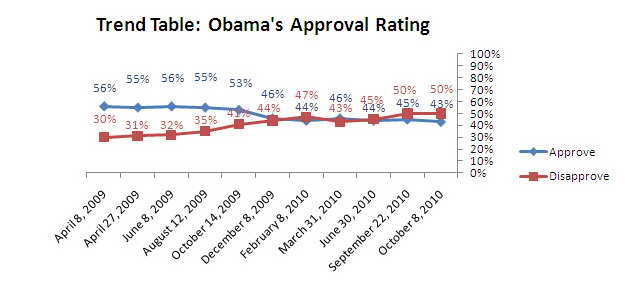
Half of registered voters nationwide — 50% — disapprove of the job President Barack Obama is doing in office while 43% approve. Seven percent are unsure.
Click Here for Complete October 8, 2010 USA McClatchy-Marist Poll Results and Tables
Little has changed since the last national McClatchy-Marist survey. In that September poll, the same proportion of the national electorate — 50% — disapproved of the president’s job performance while 45% approved. Five percent were unsure.
“The battle lines are drawn for the midterm elections,” says Dr. Lee M. Miringoff, Director of The Marist College Institute for Public Opinion. “President Obama’s approval rating is not a disaster, but it’s not high enough to be a battle cry for many of his fellow Democrats facing the 2010 electorate.”
Nearly three-quarters of Democratic voters — 74% — say they approve of the job the president is doing while 20% disapprove. 6% are unsure. Last month, 81% of Democratic voters gave Obama a thumbs-up, 15% viewed his performance as subpar, and 4% were unsure
Across the aisle, 85% of Republicans disapprove of how the president is doing while 12% approve. Three percent are unsure. In McClatchy-Marist’s September survey, a similar proportion of Republican voters — 82% — were dissatisfied with the president’s job performance, 13% approved, and 6% were unsure.
A majority of independent voters nationwide — 54% — still disapprove of the president’s job performance, 35% approve, and 11% are unsure. Last month, a majority of these voters — 54% — disapproved, 40% approved, and 6% were unsure.
Despite the president’s 43% approval rating, a majority of voters — 51% — think the president’s approach will eventually solve the problems facing the nation. But, he needs more time. 45% report Mr. Obama’s approach will not solve the nation’s problems. Four percent are unsure.
Not surprisingly, there is a partisan divide on this question as well. 81% of Democrats think the president’s approach needs more time while 15% say his efforts will be futile. On the other hand, 76% of Republicans think the president’s approach will not fix America’s problems compared with 20% who say patience is in order. A majority of independent voters — 54% — report the president’s approach will not fix the problems facing the nation while 42% think they will in time.
Table: Obama Approval Rating
Table: Obama Approval Rating Over Time
Table: Obama’s Approach to Solving the Nation’s Problems
More Than Six in Ten View Economic Conditions as Inherited
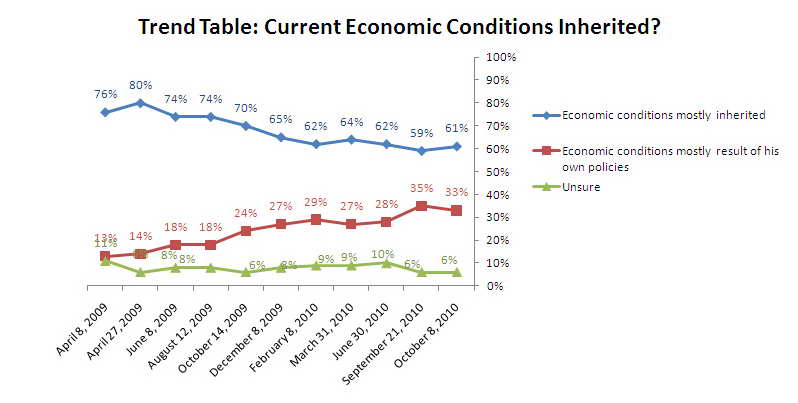
Although more than six in ten voters — 61% — believe the president inherited the nation’s current economic conditions, about one-third — 33% — report they are a product of Mr. Obama’s own policies. Six percent are unsure. Voters’ views are consistent with the September McClatchy-Marist poll. At that time, 59% reported the president inherited the nation’s financial troubles while 35% thought Mr. Obama’s policies were to blame. Six percent were unsure.
Table: Current Economic Conditions Inherited
Table: Current Economic Conditions Inherited Over Time
Better or Worse? The Future of the U.S. Economy
Half of Americans — 50% — believe that, when thinking about the U.S. economy, the worst is still to come. 46%, on the other hand, report the worst is behind us, and 4% are unsure. Little has changed on this question since last month when 52% thought the worst is yet to come, 44% reported the worst was behind us, and 4% were unsure.
Looking at registered voters nationally, nearly half — 49% — say the worst of the nation’s economic news is ahead of us while 46% believe it is behind us. Five percent are unsure. This is relatively unchanged from last month.
Table: U.S. Economy – Will It Get Worse?
Half of Voters with Favorable View of Obama
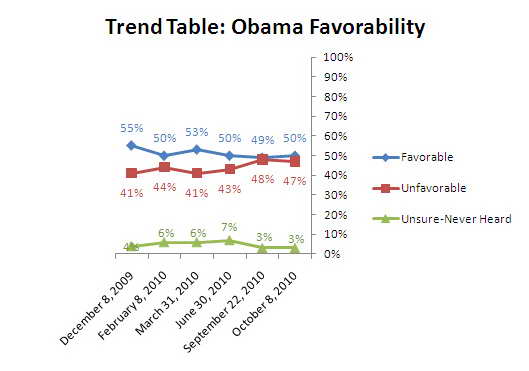
Despite his job approval rating of 43%, President Obama is perceived favorably by half of voters nationally while 47% have an unfavorable impression of him. Three percent are unsure. Last month, 49% thought well of Mr. Obama while 48% did not. Three percent were unsure.
Table: Obama Favorability
Table: Obama Favorability Over Time
Palin, Obama, and Bloomberg in 2012?
What impact would an independent candidate Michael Bloomberg make in the 2012 presidential election? In this hypothetical matchup, President Obama receives 44% of the electorate to former Alaska Governor Sarah Palin’s 29%. New York City Mayor Michael Bloomberg garners 18% of the vote. Nine percent are undecided. When Marist last asked about this potential matchup in February, 44% backed the president, 29% supported Palin, and 15% touted Bloomberg. 12% were undecided.
While most Democratic voters report they would support Obama, Republican voters are more fractured. Among Democrats, Obama receives 78% of the vote, Bloomberg takes 11%, and Palin garners 6%. Five percent are undecided.
While more than six in ten Republican voters — 62% — support Palin, about one in five — 21% — say they would vote for Bloomberg. Obama receives 8% of the Republican vote. Nine percent are undecided.
Among independent voters, Obama takes 37% of their support, Palin nets 27%, and Bloomberg receives 23%. 13% are undecided.
Table: Hypothetical 2012 Presidential Matchup: Obama/Palin/Bloomberg

