October 20, 2010
10/20: Washington Senate Race
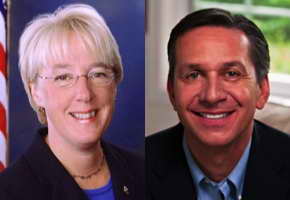
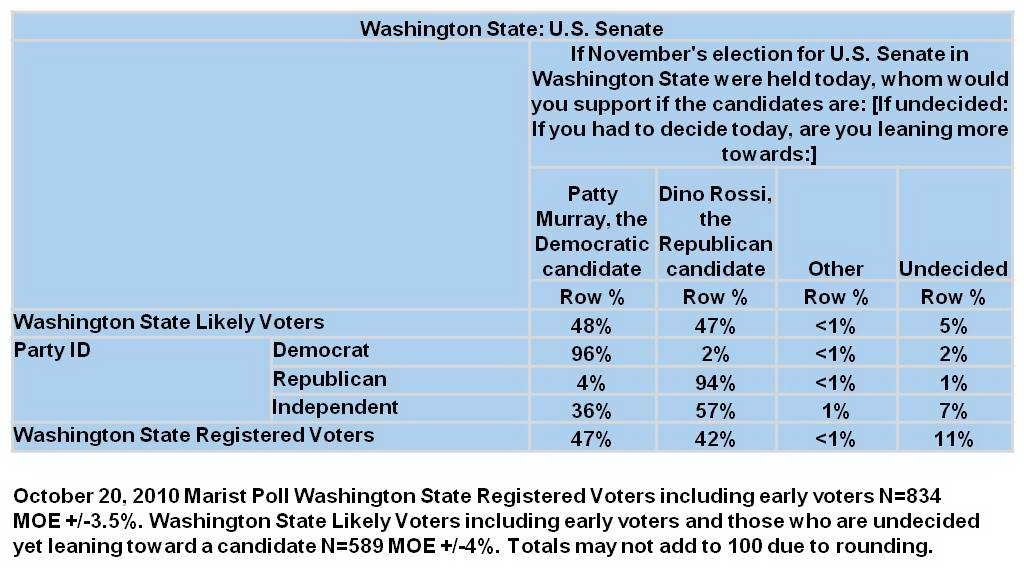
Democrat Patty Murray was first elected to the U.S. Senate in an upset victory in 1992. But now, she is in the fight of her political life. According to this McClatchy-Marist Poll of Washington State, Murray and her Republican challenger, Dino Rossi, are neck and neck. Among likely voters including those who are undecided yet leaning toward a candidate, Murray receives 48% to Rossi’s 47%. Five percent are undecided.
Click Here for Complete October 20, 2010 WA McClatchy-Marist Poll Release and Tables
Likely voters in Washington State overwhelmingly divide along party lines. 96% of likely Democratic voters back Murray while just 2% are for Rossi. Two percent are undecided. Looking at likely Republican voters in Washington, 94% support Rossi while only 4% pull for Murray. One percent is undecided. Among likely independent voters, Rossi has the advantage. Nearly six in ten — 57% — report they will vote for Rossi, 36% say they will cast their ballot for Murray, 1% plan to vote for someone else, and 7% are undecided.
Among the overall statewide electorate, 47% of registered voters support Murray while 42% back Rossi. 11% are undecided.
Table: U.S. Senate in Washington State — Murray/Rossi (Likely Voters)
Table: U.S. Senate in Washington State — Murray/Rossi (Registered Voters)
Candidates Enjoy Strong Support
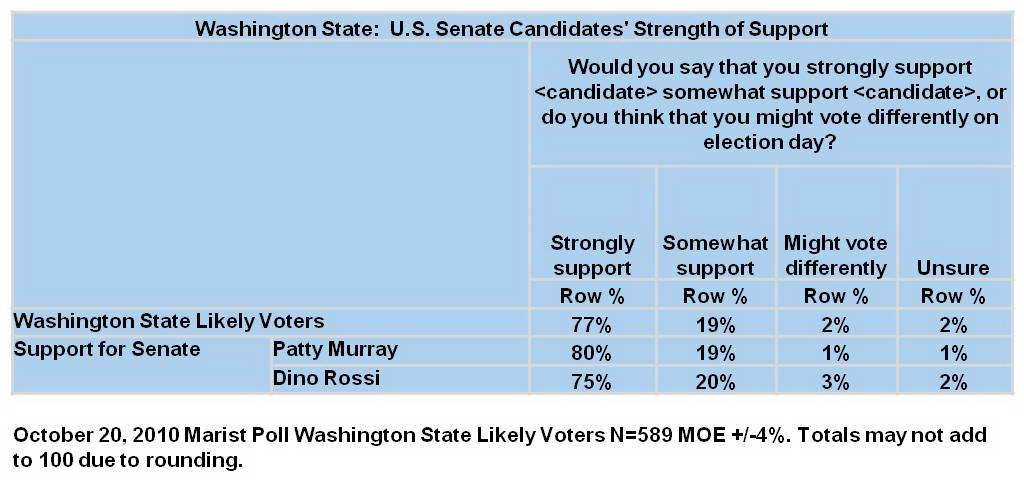
77% of likely voters in Washington State report they strongly support their choice of candidate while 19% somewhat support their pick. Two percent might vote differently on Election Day, and 2% are unsure. Looking at likely voters who support Murray, 80% strongly back her while 75% of those who are pulling for Rossi firmly support him.
Table: Candidates’ Strength of Support – Murray/Rossi
Majority for Candidate
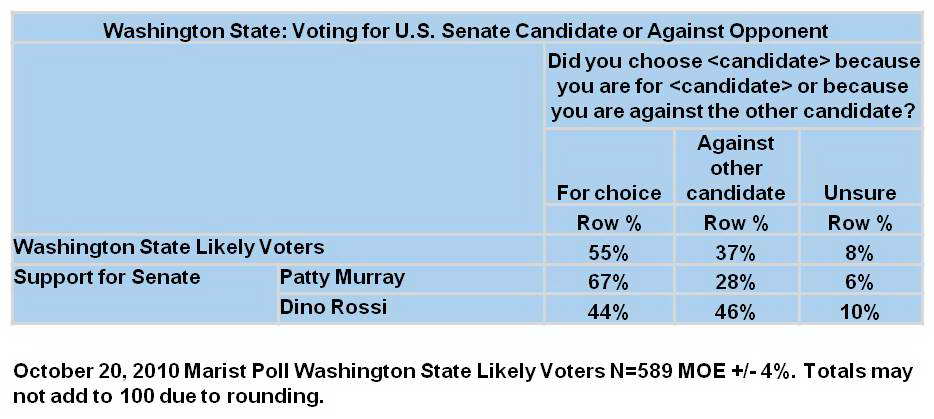
A majority of likely voters — 55% — plan to support their choice of candidate because they are for that candidate while 37% say they plan to cast their ballot for their pick because they are against that candidates’ opponent. Eight percent are unsure. 67% of likely voters who are Murray supporters are for her while 28% plan to back her because they are against her opponent. Likely voters who support Rossi divide. 46% are supporting him because they are against his opponent while 44% are for him.
Table: Voting for Candidate or Against Opponent?
More Republicans than Democrats Enthusiastic to Vote
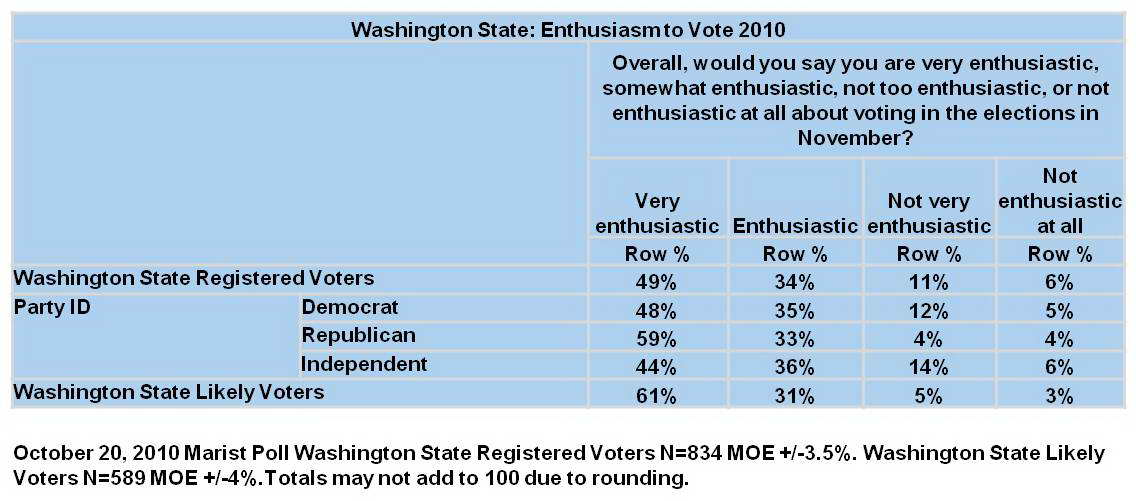
Nearly half of registered voters in Washington State — 49% — are very enthusiastic about voting in this November’s elections. Looking at party, 59% of Republican voters are very enthusiastic while 48% of Democratic voters and 44% of independent voters share a similar level of enthusiasm.
Voters’ Impressions of the Candidates
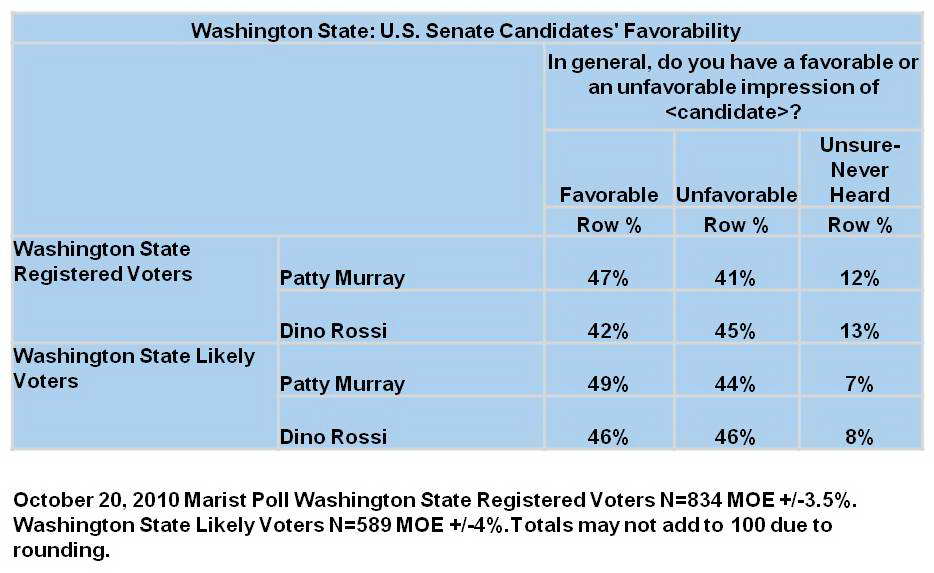
Among registered voters, 47% have a favorable impression of Patty Murray compared with 41% who give her an unfavorable rating. 12% are unsure. Registered voters divide about Dino Rossi’s image. 45% have an unfavorable perception of Rossi while 42% see him favorably. 13% are unsure.
Table: Murray Favorability
Table: Rossi Favorability
Obama Approval Rating at 49% Among Washington Voters
49% of voters in Washington State approve of the job President Barack Obama is doing in office while 44% disapprove. Seven percent are unsure.
Better or Worse? Views on the U.S. Economy
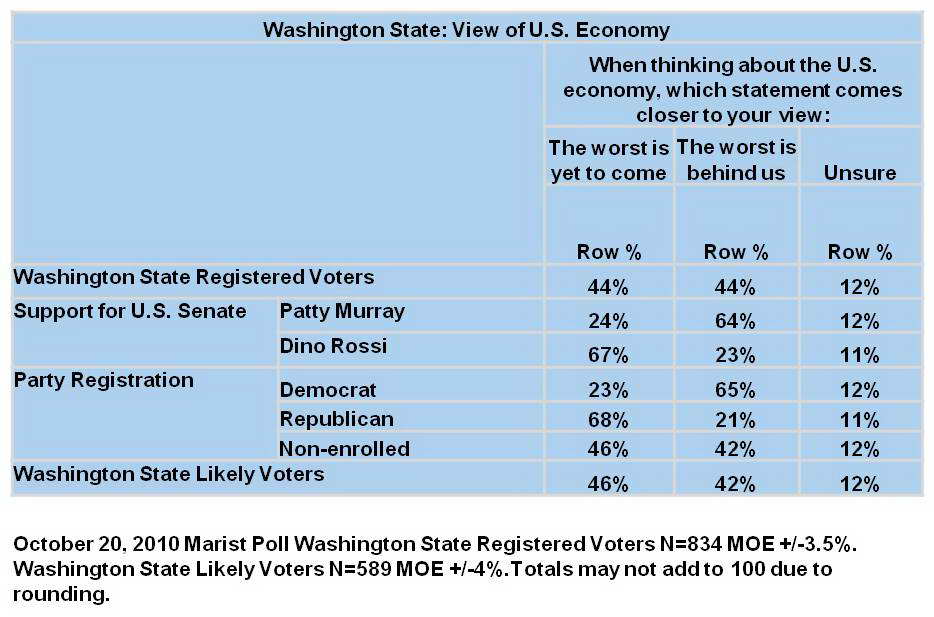
When thinking about the U.S. economy, 44% of registered voters in Washington State believe the worst is yet to come while the same proportion — 44% — think the worst is behind us. 12% are unsure.

