Scene from movie Dazed & confused of students standing, sitting, and laying on and inside an orange convertible car

We Should Hang Out More

Movies often serve as perfect time capsules, offering snapshots of what life was like in an earlier time. Take Dazed and Confused. The movie is set in late seventies Texas and focuses on groups of ... Read Now >

9/9: There’s Nothing Wrong with the Margin of Error that a Little Understanding Won’t Cure

By Dr. Lee M. Miringoff

Next time you hear a media report on a public poll, who’s ahead in an election or the approval rating of an elected official, you’re also likely to be told about the poll’s so-called margin of error.  Don’t jump to any hasty conclusions about some mistake that was made in conducting the poll.  There’s nothing really wrong with the margin of error.  Instead, it’s an acceptable range that underscores why all polls are estimates.
caricature of Lee MiringoffIf President Obama’s approval rating is reported as 46%, plus or minus 3%,  that means if everyone in the population,  not just 1,000 Americans, had been interviewed, the actual result would have fallen somewhere between 49% (46% plus 3%) and 43% (46% minus 3%).

The margin of error is a statistical calculation based upon the number of successfully completed interviews.  It’s part and parcel of all scientifically conducted public opinion research.  The more people you interview, the lower the margin of error; the fewer interviews, the range widens, and the poll results are less precise.  But, it’s not an error, and it’s not some sneaky fudge factor used in polls to allow for an acceptable amount of mistakes in measuring public opinion.

Now, there’s plenty that can, and often, does go wrong in measuring public opinion.  How was the sample selected, were attempts made to reach cell phone only households, were the questions appropriately worded and asked in a reasonable sequence, was the quality of the interviewing up to professional standards, were repeated attempts made to contact hard-to-reach respondents, and was the weighting of the data carried out in an expert way?  These are all vital issues that affect poll accuracy.  But, they have nothing to do with the margin of error.

What does this mean for the consumer of public polls?  Take the case of two public polls.  Poll A completes 1,000 interviews.  But, the sample was not drawn well, cell phones were not contacted, question wording was shoddy, the question order badly impacted survey results, the interviewers were poorly trained, multiple callbacks were not done in an attempt to contact hard-to-reach respondents, and the weighting of the data was sloppy.   The margin of error for Poll A is…  plus or minus 3%.

On Poll B.  In this case, the sample was selected to reflect the population, cell phone only households were included, the survey utilized excellently worded questions, administered in a well thought out order, with highly trained interviewers, who made multiple attempts to reach potential respondents, and the data was weighted with expertise.  The margin of error for Poll B is… not fair looking over anyone else’s shoulder… plus or minus 3%.

So, the next time you hear a reporter cite a poll’s margin of error, think of this as not a mistake, but simply as an unappreciated statistical concept in search of better understanding.

8/1: Methodology Should be Methodology, whether a Public Poll* or an Academic Survey

It’s no secret that academic survey researchers and public pollsters have very different goals for their work. Public pollsters are gathering data to quickly measure the current environment and find out who thinks what.  In contrast, academic researchers ponder why the environment is what it is, and what the implications of their findings are for theoretical approaches in their discipline.   I have worked on both sides of this equation, and have been questioned for my career choice quite a bit given my graduate school and postdoctoral training in academia. Even though I’m working for an academic institute, the perceived focus on public polling and not having “professor” in my job title seems to lead to the idea that somehow I “sold out.” But “we’re not so different, you and I.” All credible surveys rely on complex, rigorous methodology, regardless of purpose.

Natalie Jackson

The difference in purpose is best illustrated by comparing public pre-election polls to the American National Election Study (ANES), conducted for every presidential election since 1948. Pre-election polls are ubiquitous prior to elections. If the data were collected more than a few days ago, the numbers are considered “old” and no longer relevant. On the other hand, the ANES gathers two waves of data which are processed, cleaned, and carefully combed through prior to public release several months after the election. ANES data are primarily used in academic publications that may emerge years or even decades after the initial data collection. Public polling data chronicle public reactions to the give and take of campaigns and events for a 24/7 news cycle, magazines, and popular books.

Public polls often stoke more controversy than academic work, especially election polling because there is something to compare the election polls to in order to verify accuracy—the actual election returns. Reputations are gained and lost very quickly over one errant poll (which, by the way, is statistically guaranteed to happen to everyone sooner or later simply by the laws of probability).  There are clear expectations of transparency in methods of public polls, and they are dissected by anyone with an opinion and a keyboard.

On the other hand, there are usually few guidelines to provide checks on conclusions about how or why people think the way they do or for the vast majority of survey sample findings in academic work. And, rarely do they have quantifiable verification.  Academic reputations are gained by publication, which is generally earned through the perceived importance of the findings in a peer review process and are not usually the subject of public scorn, argument or debate about “bias,” as the public polls were in the 2012 election cycle.

Despite these differences, the intersection of these two diverse approaches is found in the underlying methodology.  How do we best measure what we’re trying to measure? The question is the same regardless of the goal or use of the data. We are united by the desire to get the best quality data, from the best and most representative samples, and to do this within budget constraints that are often outside our control. There is also a need to innovate and stay on the cutting edge of technology while being careful to not step beyond the scientific bounds to achieve reliability and validity of our samples and polls.

We each think statistically, creatively, and scientifically about survey sampling and data collection. But it doesn’t end there. We think psychologically and ethically about the people who so graciously (or through some artful persuasion) provide us with the information we seek. How do people hear questions? What does each word mean to 1,000 or more different people? How does the order of our words and our questions affect what people hear and how they answer? In some modes, an additional question is how the interviewer administering the survey affects the respondent’s experience and how they hear and answer questions.

These difficulties are shared by everyone who engages in any type of survey research—whether academic, public polling, market research, private polling, or evaluation work—if we care about producing high-quality reliable and valid data. We are trying to achieve statistical precision about human behavior by crafting methodologies that weave together sampling theory, statistics, psychology, sociology, political science, evaluation theories, and technology.

Creating this tapestry is the heart of survey research, and what better place to do methods work than a place where journalists, partisan devotees with agendas, and the general public are constantly looking over your shoulder questioning how your polls were done and whether you were “right” about a given election? I deal with the same methodological puzzles, struggles, and need for innovation that I dealt with in my academic positions, only in a fast-paced and very public environment. So please, can we stop pretending that academic survey researchers and public pollsters are so different, or that one is better than the other? We all put our pants on one leg at a time—and we all learned our sample statistics one t-score at a time.  Besides, last time I checked there were a lot of smart and talented PhDs around here too.


*”Public polling” and “public pollsters” refer only to those who do nonpartisan, non-candidate funded work. Funding structures may vary, but public polls are done for the benefit of the general public, not a party, candidate, PAC, Super PAC, or any politically organized entity.


7/23: Same Old, Same Old?

By Dr. Lee M. Miringoff

The latest McClatchy-Marist national poll has nothing but bad news for President Obama and Congress.  Surprising? Not really.  It’s more of the same….only more so.  Six months into his second term, President Obama’s approval rating is at a two-year low at 41%.  His GOP counterparts in Congress are scraping bottom at their lowest point with a 22% approval rating.  Congressional Democrats are only slightly better at 33%.  That’s certainly nothing to write home about to their constituents either.

caricature of Lee MiringoffIt doesn’t get any prettier drilling down into the numbers.  For President Obama, his decline from a previous poll at the end of March is across-the-board.  It is most pronounced among moderate and independent voters, but he is also taking a major hit from young voters and the Latino community.   Also, by two to one, voters nationwide wide think we are headed in the wrong direction.

President Obama’s second term began with the promise of gun control, immigration reform, and climate change.  Instead, voters have been offered the Benghazi controversy, Snowden and privacy invasion, an unsettled Middle East, and a lingering discussion over health care.

As for Congress, the nation is fed up with gridlock.  Nearly two-thirds want compromise, not a dig your feet in the sand “stand on principle.”  Even Republican voters by 50% to 41% want the legislative process to move forward.

What’s a president to do?  He cannot change the political realities of a divided Congress and a divided nation, but he always fares better when he gets outside the Beltway battles and talks about the economy.  So, off he goes starting Wednesday to Knox College where he gave his maiden speech on this national concern in 2005.

The theme is likely to be a familiar one, focusing on the middle class and opportunity.  It’s a message he carried successsfully throughout the  2008 campaign and his re-election effort last year.  He’s banking that a return to this theme and a series of campaign mode events will restart his stalled second term.

7/11: Forgive and Fuhgeddaboudit?

By Dr. Lee M. Miringoff

In case you need to be reminded from time to time, New York news is national news. But, New York City pols may be overdoing it this election cycle. With Michael Bloomberg exiting City Hall after three terms, a crowded race for mayor was a given. But, the return of Anthony Weiner from political exile following his sexting scandal created an enormous shock wave even by New York standards.

caricature of Lee MiringoffHaven’t had enough? This week disgraced former Governor Eliot Spitzer launched his own frantic campaign for city comptroller. But, if New York Democrats are experiencing candidate redemption overload, they’re hiding it well.

In the latest NBC 4 New York/Wall Street Journal/Marist Polls, both Weiner and Spitzer have demonstrated significant voter appeal. Democrats seem willing to grant these two a second chance to make a first impression. Presumably, it won’t resemble the impressions that chased each from elected office and extinguished what were expected to be long and successful political careers.

There are similarities and differences in how Weiner and Spitzer arrived at this place. But, for each, the foundation anchoring their return to politics may be that some voters discount these scandals as the basis for deciding their vote. Instead, they are of the opinion that most politicians have skeletons in their closet. Does that make Weiner and Spitzer sex scandal proof? Does this now mark the end of the political sex scandal in electoral politics?

Don’t be too hasty in jumping to these conclusions. Weiner at 25% may make the runoff in a crowded primary field, but he’ll have to double his current level of support to secure his party’s nomination. Spitzer at 42% needs to reach 50% in the primary against his sole opponent. In other words, they both have a significant amount of convincing to do.

Voters who are not really focusing on these contests will sharpen their gaze in the weeks ahead. And, for Weiner and Spitzer that will represent the true test of whether they can survive their scandals and avoid a political meltdown under the hot lights of Broadway.

6/26: Will the New York City Mayor’s Race Come Down to the Buzzer?

By Dr. Lee M. Miringoff

For those watching the Bruins/Blackhawks Stanley Cup final the other night or game six of the NBA championship, the lesson learned is to stay in your seat until the very end.  That may also be the case with the NYC Democratic Primary for Mayor.   Nonetheless, the latest Wall Street Journal/NBC New York/Marist Poll shows some interesting dynamics that deserve attention.

caricature of Lee MiringoffAnthony Weiner has weathered the first phase of his return to electoral politics, and is now in front with 25% of Democrats’ support.  His 34% positive rating from last February has now become 52%.  Would Democrats consider voting for Weiner?  In April, his numbers were upside down with 46% saying “yes” but 50% saying “no.”  Now, his numbers are right side up with 53% of Democrats telling us they’d consider voting for Weiner to only 41% who won’t.

And then, there’s the decline in support for Christine Quinn.  She remains popular with  most Democrats.  In fact, her favorable/unfavorable rating is roughly two-to-one positive.  But, it has dropped.  In February, 65% of Democrats rated her favorably to only 17% who had a negative view of her.  Now, her positive rating has fallen to 57%, and her negatives have climbed to 29%.  Not too shabby but she now occupies second place among Democrats.  She’s no longer the frontrunner.

Bill Thompson, who narrowly lost to Bloomberg last time, is in third place currently with 13% of the Democratic vote.  But, he’s a factor to be watched as the field hopes to advance to the runoff.  His positive score has jumped from 52% last month to 60% currently.  In a runoff against either Quinn or Weiner, Thompson is neck-and-neck.

Movement, yes.  But, the race remains wide open with 18% of Democrats saying they are undecided, and only 36% firmly committed to a candidate.  If, as expected, this ends up a low turnout primary, then the ability of a candidate to turn out his or her base will be crucial.  That mobilization is not likely to be evident until the closing weeks of the campaign when voters are paying more attention.  Until then, these political playoffs remain very much an active contest.

4/11: The Misconceptions about Aging

What are the top five myths about getting older?  A new survey undertaken by Home Instead Senior Care and The Marist Poll highlights some surprising realities of aging.

For the results, click here.


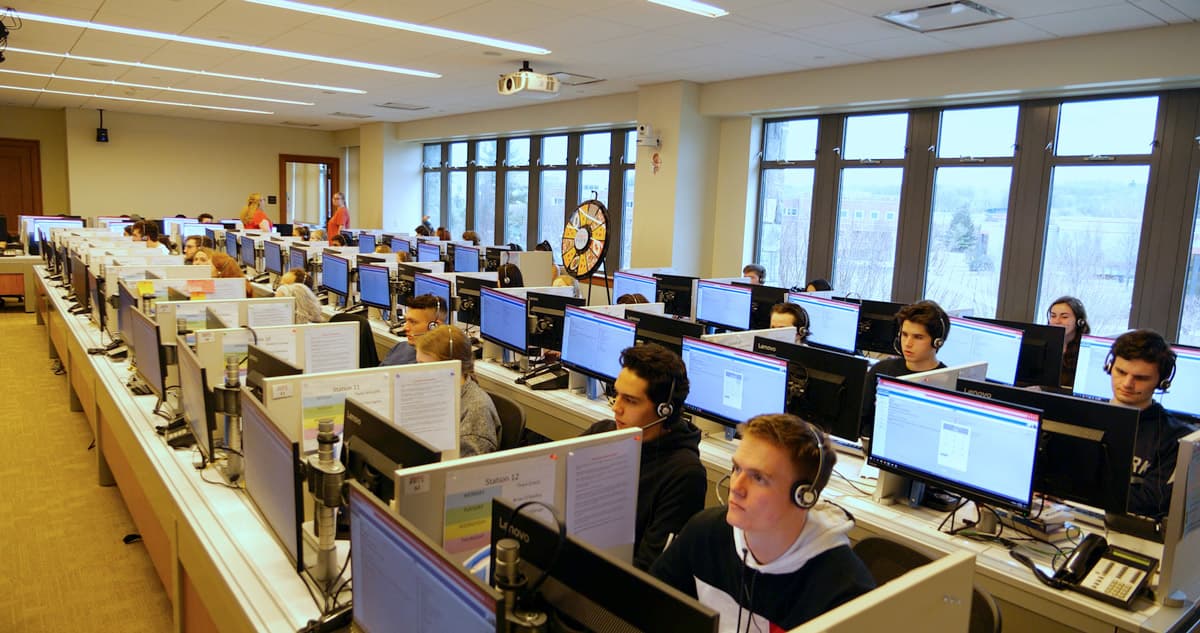
Photo of students working in the Marist Poll phone room

In Their Own Words: MIPO’s Student Workers

Do you want to know what it’s like to be part of a winning team?  The Marist Poll’s student pollsters reflect on their experiences below.

Click on the videos to learn more.

3/27: A Profile of Eric Nadel

By John Sparks
So what happens when a young Jewish boy from Brooklyn decides not to follow his father’s footsteps into dentistry?  The dental profession’s loss is baseball’s gain.  For more than three decades Eric Nadel has been the radio voice of the Texas Rangers.  For the last two years, Nadel has been a finalist for the National Baseball Hall of Fame’s Ford Frick Award presented to a broadcaster for major contributions to baseball.

Marist Poll Senior Editor John Sparks caught up with Nadel at the Rangers Spring Training site in Surprise, Arizona.  Watch the video below.

3/13: The Latest from Spring Training

By John Sparks

What does Major League Baseball’s American League West look like this year?  What are the chances of the Los Angeles Angels, and what are the odds they will face-off against the Dodgers in the World Series?

The Marist Poll’s John Sparks is in Peoria, Arizona with the latest.  View his discussion with Dr. Lee M. Miringoff, Director of The Marist College Institute for Public Opinion:

3/11: The Marist Poll Goes to Spring Training

Major League Baseball’s Opening Day is still a few weeks away, journalists and sports fans alike flock to Spring Training games. Among them is Senior Editor for the Marist Poll website, John Sparks!

What’s the latest from the field in Surprise, Arizona?  MIPO’s Director Lee M. Miringoff spoke with Sparks via Skype about today’s sights and sounds. Check out the video: