August 16, 2013
8/16: Tight Race in Democratic Primary for NYC Mayor
NBC 4 NY/WSJ/Marist New York City Poll
With less than a month to go until Primary Day, Democrats Christine Quinn and Bill de Blasio are locked in a tight race in their pursuit of the Democratic nomination for New York City mayor. Bill Thompson is currently in third. Among registered Democrats in New York City, including those who are undecided yet leaning toward a candidate, just eight percentage points separate these three candidates, and only six percentage points are between them among Democrats likely to vote on Primary Day. The scandal-ridden Anthony Weiner trails in fourth place.
 Among registered Democrats in New York City, including those who are undecided yet leaning toward a candidate, if the Democratic primary were held today, here is how the contest would stand:
- 24% Christine Quinn
- 21% Bill de Blasio
- 16% Bill Thompson
- 12% Anthony Weiner
- 6% John Liu
- 2% Erick Salgado
- 1% Sal Albanese
- 1% Randy Credico
- <1% Neil Grimaldi
- 3% Other
- 15% Undecided
POLL MUST BE SOURCED: NBC 4 New York/Wall Street Journal/Marist Poll
“It’s been a topsy-turvy summer, and many Democratic voters are still waiting to be convinced,” says Dr. Lee M. Miringoff, Director of The Marist College Institute for Public Opinion. “Although voters have yet to sort things out, Bill de Blasio has shown the biggest gain in the last couple of weeks.”
It was a very different contest just three weeks ago when the NBC 4 New York/Wall Street Journal/Marist Poll last reported this question on July 25th. At that time, Quinn — 25% — outpaced Weiner — 16% — by nine percentage points among New York City Democrats, including those who were undecided yet leaning toward a candidate. De Blasio and Thompson each received the support of 14% of the Democratic electorate. At that time, 7% backed John Liu while Erick Salgado had 2%. One percent supported Sal Albanese, 2% were for another candidate, and 19% were undecided.
Where Are Top-Tier Candidates’ Strengths?
- Quinn does better among Democrats who are both white and liberal — 33%, live in Manhattan — 30%, or who approve of the job Mayor Michael Bloomberg is doing in office — 29%. She also does well among Democrats who are Catholic — 28% or Latino — 27%.
- De Blasio does well among Democrats who are both white and liberal — 36%, who are Jewish — 30%, who live in Manhattan — 27%, or who earn $50,000 or more annually — 27%. De Blasio has improved his standing among Democrats who are African American. He currently receives the support of 20% of African American Democrats compared with 10% in the last poll.
- Thompson does better among Democrats who are African American — 22%, but generally receives similar support from most other groups.
Among Democrats who are likely to vote in September’s primary, de Blasio and Quinn each receive 24%. 18% back Thompson. Weiner has the support of 11% of Democrats who are likely to cast a ballot while 5% are behind Liu. Two percent are for Salgado, and 1% backs Albanese. Credico has the support of 1%, and Grimaldi receives less than one percent. Two percent are behind another candidate, and 12% are undecided.
When it comes to intensity of support, a plurality of New York City registered Democrats with a candidate preference — 43% — say they strongly support their choice of candidate. 37% are somewhat committed to their pick while 17% might vote differently. Three percent are unsure.
In NBC 4 New York/Wall Street Journal/Marist’s previous survey, 42% said they were firmly committed to their candidate. 32% were somewhat behind their choice while 23% thought they might change their mind before casting their ballot. Three percent, at the time, were unsure.
48% of de Blasio’s supporters say they will not waiver in their commitment to him. This compares with 41% of New York City Democrats who rally for Thompson and 35% of those who are for Quinn.
Table: 2013 Democratic Primary for Mayor (NYC Democrats with Leaners)
Lhota Leads Catsimatidis for GOP Nod
Looking at the contest for the Republican nomination for mayor, Joe Lhota continues to have the advantage over John Catsimatidis. George McDonald trails his GOP opponents by double-digits. However, three in ten Republicans in New York City have yet to select a candidate. It’s important to keep in mind the small number of registered Republicans in this survey.
Among registered Republicans in New York City including those who are undecided yet leaning toward a candidate, if the Republican primary were held today, here is how the contest would stand:
- 33% Joe Lhota
- 22% John Catsimatidis
- 12% George McDonald
- 2% Other
- 30% Undecided
When NBC 4 New York/Wall Street Journal/Marist last reported this question in June, Lhota — 28% — led Catsimatidis — 21% — by 7 percentage points among New York City Republicans, including those who were undecided yet leaning toward a candidate. 10% backed George McDonald, and 1% were for another candidate. 40% were undecided.
How strongly committed are Republicans to their choice of candidate? 43% of those with a candidate preference are strongly committed to their choice. 34% are somewhat behind their pick while 17% might change their mind. Six percent are unsure.
Table: 2013 Republican Primary for Mayor (NYC Republicans with Leaners)
No Runaway in Runoff Races… But de Blasio has Edge
If none of the candidates receive 40% of the vote in the Democratic primary for mayor, a runoff for the Democratic nomination will be held. How would the top-tier candidates fare in such a situation?
Among New York City Democrats:
- When de Blasio and Quinn face off, de Blasio receives the support of 44% of registered Democrats compared with 42% for Quinn. 14% are undecided. In NBC 4 New York/Wall Street Journal/Marist’s June poll, Quinn — 47% — outpaced de Blasio — 33% — by 14 percentage points. 21% were undecided. Among likely Democratic voters, 47% are currently for de Blasio compared with 40% for Quinn. 12% are undecided.
- Thompson — 44% — and Quinn — 43% — are also neck and neck among registered Democrats. 12% are undecided. When NBC 4 New York/Wall Street Journal/Marist last reported this question nearly two months ago, Quinn received the support of 42% of Democrats compared with 40% for Thompson. 18%, at the time, were undecided. Looking at likely Democratic voters this time, Thompson garners 47% to 42% for Quinn. 11% are undecided.
- De Blasio receives 44% compared with 36% for Thompson in a runoff among registered Democrats. 20% are undecided. Among likely Democratic voters in this survey, 47% are for de Blasio while 36% back Thompson. 16% are undecided.
Table: Runoff Quinn vs. de Blasio (NYC Democrats)
Table: Runoff Quinn vs. Thompson (NYC Democrats)
Table: Runoff Thompson vs. de Blasio (NYC Democrats)
Boost for de Blasio… Weiner’s Favorability at New Low
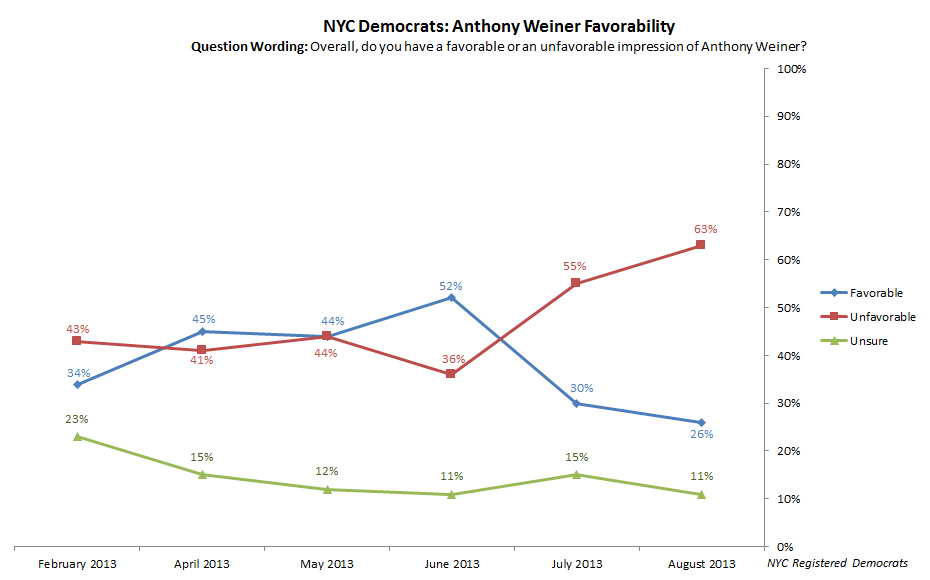
A majority of registered Democrats citywide view the top-tier Democratic candidates running for mayor positively. This includes de Blasio who enjoys a bump in his positive rating. Anthony Weiner’s favorability rating has sunk to an all-time low.
- Nearly six in ten New York City Democrats — 59% — have a positive impression of de Blasio while 14% have an unfavorable view of the candidate. 26% have either never heard of him or are unsure how to rate him. When NBC 4 New York/Wall Street Journal/Marist last reported this question in June, 52% thought highly of de Blasio. 19% had an unfavorable opinion of him, and 29% had either never heard of him or were unsure how to rate him.
- 56% of registererd Democrats have a favorable view of Thompson. 18% have an unfavorable impression of him, and 26% have either never heard of him or are unsure how to rate him. In June, 60% had a positive opinion of Thompson, and 16% had an unfavorable impression of him. 25%, at the time, had either never heard of him or were unsure how to rate him.
- A majority of registered Democrats — 54% — has a favorable impression of Quinn. 32% have an unfavorable opinion of her while 13% have either never heard of her or are unsure how to rate her. In June, 57% thought well of Quinn, 29% had an unfavorable impression of her, and 14% had either never heard of her or were unsure how to rate her.
- When it comes to Weiner, 63% of registered Democrats citywide have an unfavorable opinion of him. 26% think well of him while 11% have either never heard of him or are unsure how to rate him. When NBC 4 New York/Wall Street Journal/Marist last reported this question on July 25th, 55% had an unfavorable opinion of Weiner. 30% had a positive impression of the candidate, and 15% had either never heard of him or were unsure how to rate him.
Table: Bill de Blasio Favorability (NYC Democrats)
Table: Bill Thompson Favorability (NYC Democrats)
Table: Christine Quinn Favorability (NYC Democrats)
Table: Anthony Weiner Favorability (NYC Democrats)
Table: Anthony Weiner Favorability Over Time (NYC Democrats)
Spitzer with Double-Digit Lead over Stringer in Comptroller’s Race
In the Democratic primary for New York City comptroller, Eliot Spitzer receives majority support — 53% — among New York City registered Democrats including those who are undecided yet leaning toward a candidate. This compares with 34% for Scott Stringer. One percent is for another candidate, and 11% are undecided.
When NBC 4 New York/Wall Street Journal/Marist last reported this question on July 25th, 49% backed Spitzer, and 32% were for Stringer. Two percent backed another candidate, and 17% were undecided.
Among Democrats who are likely to vote in September’s primary, 54% are behind Spitzer while 36% are for Stringer. One percent backs another candidate, and 9% are undecided. Last time, Spitzer — 48% — led Stringer — 36% — by 12 percentage points among Democrats likely to vote on Primary Day.
48% of New York City registered Democrats with a candidate preference for comptroller strongly support their choice. 37% are somewhat committed to their candidate while 14% might vote differently. Two percent are unsure.
More registered Democrats today are strongly committed to their candidate selection for comptroller. When this question was last reported on July 11th, 39% of Democrats with a candidate preference said they were firmly committed to their choice, and 36% reported they were somewhat behind their pick. 22% thought they might vote differently, and 2% were unsure.
A majority of Spitzer’s supporters — 51% — say they are firmly committed to their candidate. This compares with 43% of Stringer’s backers who say the same. There has been a notable increase in the proportion of Democrats who strongly support Stringer. In early July, 30% of Stringer’s supporters were firmly committed to him. This compares with 47% of those who firmly backed Spitzer at that time.
Table: 2013 Democratic Primary for Comptroller (NYC Democrats with Leaners)
Table: Intensity of Support for Comptroller Candidates (NYC Democrats with a Candidate Preference)
Majority of Democrats Are Undecided in Public Advocate Race
In the contest for the Democratic nomination for New York City’s public advocate, 51% of registered Democrats are undecided about which candidate to support.
Among registered Democrats in New York City, including those who are undecided yet leaning toward a candidate, if the Democratic primary for public advocate were held today, here is how the contest would stand:
- 16% Letitia James
- 12% Catherine Guerriero
- 9% Daniel Squadron
- 3% Reshma Saujani
- 2% Sidique Wai
- 7% Other
- 51% Undecided
When NBC 4 New York/Wall Street Journal/Marist last reported this question in its June 26th poll, James received the support of 17% of New York City registered Democrats, including those who were undecided yet leaning toward a candidate. 16% supported Guerriero. Eight percent backed Squadron, and 4% were for Saujani. Less than one percent supported another candidate, and 54% were undecided.
Among Democrats who are likely to vote in September’s primary, 16% support James. Guerriero and Squadron each receives the backing of 12%. Saujani has 3%, and 2% are for Wai. Six percent want to elect another candidate, and 49% are undecided.
Among registered Democrats with a candidate preference for public advocate, 38% are strongly committed to their candidate. 34% somewhat back their choice while 25% might vote differently. Two percent are unsure.
In June, 34% strongly supported their candidate. 43% were somewhat behind their choice for public advocate while 20% reported they might change their mind. Two percent, at the time, were unsure.
Table: 2013 Democratic Primary for Public Advocate (NYC Democrats with Leaners)
Bloomberg Approval Rating Steady
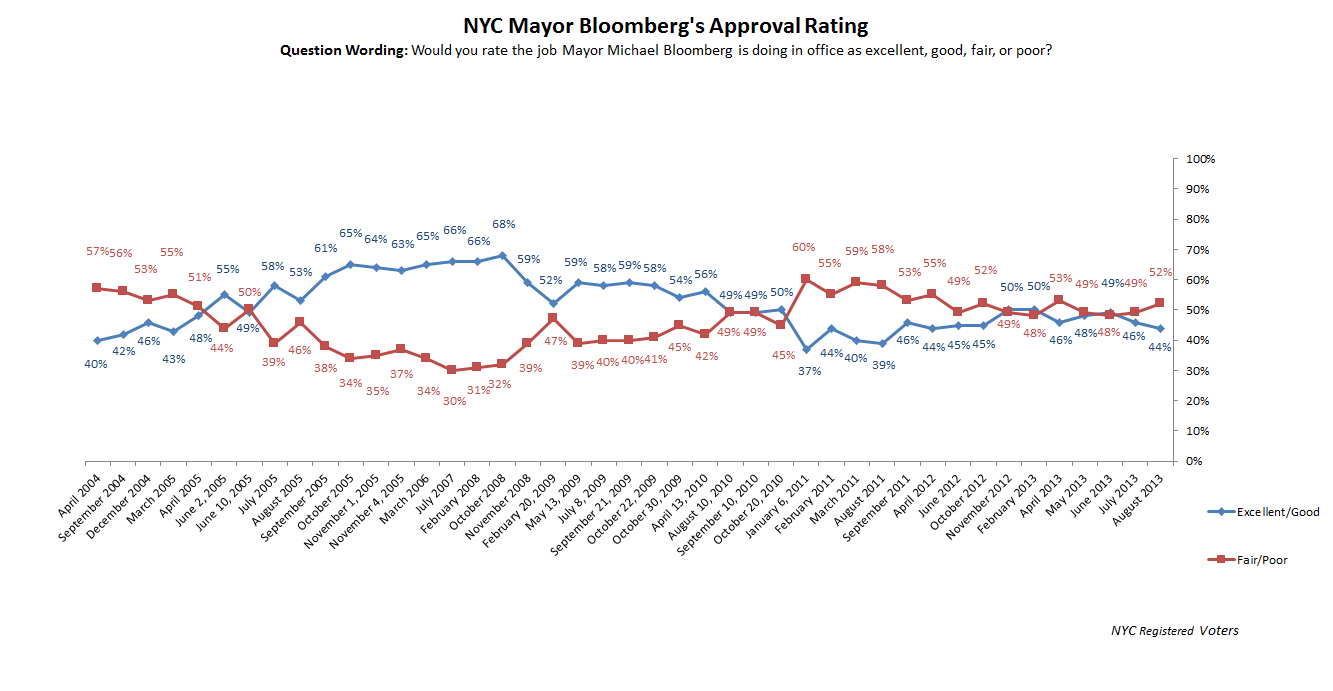
44% of registered voters in New York City approve of the job Mayor Michael Bloomberg is doing in office. This includes 11% who say he is doing an excellent job and 33% who think he is doing a good one. 31% rate his performance as fair while 21% report he is doing poorly in office. Five percent are unsure.
When NBC 4 New York/Wall Street Journal/Marist last reported this question on July 11th, similar proportions held these views. 46% said Bloomberg was doing either an excellent or good job as mayor. 28% gave him fair grades while 21% believed his performance fell short. Five percent, at the time, were unsure.
Table: Bloomberg Approval Rating (NYC Registered Voters)
Table: Bloomberg Approval Rating Over Time (NYC Registered Voters)
A City on Track?
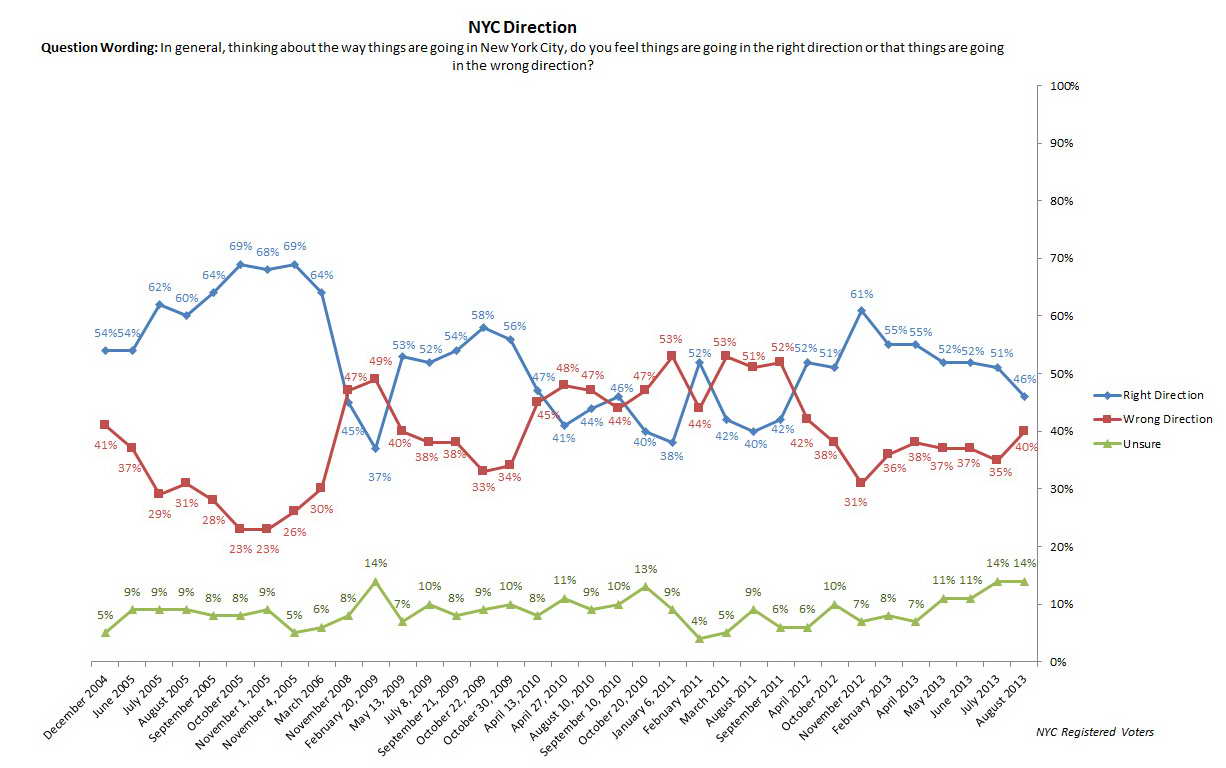
46% of registered voters in the Big Apple believe New York City is moving in the right direction. 40% think it is traveling in the wrong direction, and 14% are unsure. This is the first time since September 2011 that the proportion of voters citywide who think the city is on the right course has fallen below 50%. At that time, 42% said the city was on track, 52% reported it was off course, and 6% were unsure.
When NBC 4 New York/Wall Street Journal/Marist last reported this question in July, a slim majority of voters — 51% — said the city was moving in the right direction. 35% believed it needed a new course, and 14% were unsure.
Table: New York City Direction (NYC Registered Voters)
Table: New York City Direction Over Time (NYC Registered Voters)


