April 16, 2013
4/16: Weiner Candidacy Could Scramble Democratic Primary
NBC 4 New York/Marist New York City Poll
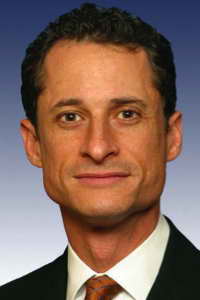
Nearly two years after resigning his Congressional seat due to a sexting scandal, how do New York City voters react to Anthony Weiner’s potential run for mayor? When he is included in the field of candidates for the Democratic nomination, Weiner receives the support of 15% of Democratic voters, placing him second after frontrunner Christine Quinn.
Among registered Democrats in New York City, including those who are undecided yet leaning toward a candidate, if the Democratic primary were held today, here is how the contest would stand with Anthony Weiner in the race:
- 26% Christine Quinn
- 15% Anthony Weiner
- 12% John Liu
- 11% Bill de Blasio
- 11% Bill Thompson
- 2% Sal Albanese
- 1% Other
- 22% Undecided
Click Here for Complete April 16, 2013 NYC NBC New York/Marist Poll Release and Tables
“Right now, a Weiner candidacy attracts double-digit support in the Democratic primary,” says Dr. Lee M. Miringoff, Director of The Marist College Institute for Public Opinion. “He makes it even more difficult for any of the Democratic contenders to reach the needed forty percent to avoid a run-off.”
When Democratic voters are asked to select their preference in the primary for New York City mayor without Anthony Weiner in the race, City Council Speaker Christine Quinn continues to outpoll her rivals. However, her support has declined from a similar survey conducted in February.
Among registered Democrats in New York City including those who are undecided yet leaning toward a candidate, if the Democratic primary were held today, here is how the contest would stand without Anthony Weiner in the race:
- 30% Christine Quinn
- 15% Bill de Blasio
- 14% Bill Thompson
- 11% John Liu
- 2% Sal Albanese
- 2% Other
- 26% Undecided
When Marist last reported this question in February, 37% of Democratic voters including those who were undecided yet leaning toward a candidate supported Quinn. 13% backed Thompson, and 12% were for de Blasio. Nine percent supported Liu while only 2% backed Albanese. One percent was for another candidate, and 26% were undecided.
To punctuate the fluidity of the Democratic primary contest, only 34% of Democrats who have a candidate preference are firmly committed to that candidate. 30% are somewhat behind their pick while 35% might vote differently. Two percent are unsure. In February’s survey, three in ten Democrats with a candidate preference — 30% — said they strongly supported their choice. 34% were somewhat in their candidate’s corner while 32% thought they might vote differently on primary day. Three percent, at the time, were unsure.
When Weiner is not in the Democratic primary field, Quinn and de Blasio are each four percentage points higher, and Thompson has three percentage points more in support. Undecided is also four percentage points higher when Weiner is not listed as a candidate.
Table: 2013 Democratic Primary for Mayor with Anthony Weiner (NYC Democrats with Leaners)
Table: 2013 Democratic Primary for Mayor (NYC Democrats with Leaners)
Table: Intensity of Support (NYC Democrats)
A Redemption Story? Democrats Not Keen on Weiner Run for Mayor, But…
As Weiner contemplates his return to elective politics, 40% of registered Democrats want Weiner to seek the mayoralty, while 46% do not want him to run. 14% are unsure. Citywide, only 37% want him to run, while 47% do not want to see him become a candidate for mayor this year. 16% are undecided.
However, these numbers have improved for Weiner since a similar Marist Poll conducted last October. At that time, only 28% of registered Democrats wanted Weiner to throw his hat into the ring. 57% did not, and 14% were unsure. Among all registered voters, only one in four – 25% — wanted Weiner to enter the contest for mayor and 58% did not want him to run. 17% were unsure. At the height of Weiner’s political difficulties in June 2011, 25% of voters wanted Weiner to run for mayor. 56% did not, and 19% were unsure.
Weiner’s favorability has also improved. He now has a net positive rating among registered Democrats. 45% of Democrats have a favorable view of Weiner while 41% have an unfavorable impression of him. 15% have either never heard of him or are unsure how to rate him. Two months ago, his rating was upside down. Only 34% of Democrats viewed Weiner favorably at that time, and 43% had an unfavorable impression of him. 23% were unsure how to rate him or had never heard of him.
Overall, 39% of registered voters have a favorable impression of Weiner, while 43% have an unfavorable impression of him. 19% are unsure or have never heard of him. This is also an improvement from two months ago when only 30% had a positive impression of Weiner, and 46% did not think well of him. 24% had either never heard of him or were unsure how to rate him at that time.
Would New York City voters consider casting their ballot for the scandal-scarred former congressman? Among Democrats, 46% are open-minded about a Weiner candidacy while 50% would not consider voting for him for mayor. Five percent are unsure. Among all registered voters, 40% say that they would consider voting for him. But, 52% would not, and 8% are unsure.
Is it a question of character? There’s little consensus. 37% of Democrats think Weiner has changed as a person in the past two years while 32% believe he has not reformed. 31% are unsure. Citywide 33% of registered voters think he has changed during this time, 33% believe he has not, and 34% are unsure.
Table: Former Congressman Anthony Weiner 2013 Mayoralty?
Table: Anthony Weiner Favorability (NYC Democrats)
Table: Anthony Weiner Favorability (NYC Registered Voters)
Table: Consider Voting for Former Congressman Anthony Weiner?
Table: Has Former Congressman Anthony Weiner Changed as a Person?
All Democratic Hopefuls Viewed Less Favorably
59% of New York City Democrats have a positive impression of Quinn while 23% have an unfavorable one. 18% have either never heard of her or are unsure. Slightly fewer Democrats now think well of Christine Quinn. Two months ago, nearly two-thirds of Democrats, 65%, had a favorable opinion of her. 17% had an unfavorable one, and 18% had either never heard of her or were unsure how to rate her.
What are Democrats’ views toward the other candidates in the field?
- 43% have a favorable view of Bill Thompson. 21% have an unfavorable one, and 36% have either never heard of him or are unsure how to rate him. In February, almost half of Democrats — 49% — had a positive opinion of Thompson. One in five — 20% — had an unfavorable one, and 31% had either never heard of him or were unsure how to rate him.
- Looking at de Blasio’s image, 42% of Democrats think well of him while 23% do not. 35% have either never heard of him or are unsure how to rate him. In Marist’s previous survey, 48% of Democrats had a favorable impression of de Blasio. 20% had an unfavorable view of him, and 32% had either never heard of him or were unsure how to rate him.
- 40% of Democrats have a favorable opinion of Liu while 32% do not. 28% have either never heard of him or are unsure how to rate him. In February, 43% had a positive impression of Liu. 27% had an unfavorable one, and 30%, at the time, had either never heard of him or were unsure how to rate him.
- Albanese has failed to make inroads with his party’s faithful. Just 18% of Democrats have a positive view of him. 27% have an unfavorable impression of Albanese, and a majority — 55% — has either never heard of him or are unsure how to rate him. In February, 26% thought well of Albanese, 20% had an unfavorable view of him, and 54% had either never heard of him or were unsure how to rate him.
Table: Christine Quinn Favorability (NYC Democrats)
Table: Bill Thompson Favorability (NYC Democrats)
Table: Bill de Blasio Favorability (NYC Democrats)
Table: John Liu Favorability (NYC Democrats)
Table: Sal Albanese Favorability (NYC Democrats)
Quinn Outdistances Lhota…Weiner Also Has Advantage Over GOP Hopeful
Looking ahead to the general election, Christine Quinn gets the nod from a majority of voters citywide against Republican Joe Lhota. Quinn has the support of 59% compared with 19% for Lhota. 21% of registered voters are undecided. In February, 64% of voters backed Quinn while 18% supported Lhota. 18% were also undecided.
How does Anthony Weiner fare against Lhota? Weiner – 51% — leads Lhota – 28% — among registered voters in New York City. 21% are undecided.
Table: 2013 Race for Mayor — Quinn/Lhota
Table: 2013 Race for Mayor — Weiner/Lhota
Low Interest in Mayor’s Race
Only 38% of registered voters are paying attention to the mayor’s race. This includes 8% who are following the contest very closely and 30% who are watching it closely. 45% are not following it very closely, and 18% are not following it at all.
In February, 30% reported they were following the mayor’s race very closely or closely. 44% said they weren’t paying much attention to the contest, and 26% reported they weren’t watching it at all.
Table: How Closely Voters are Following Mayor’s Race
Bloomberg’s Approval Rating Shows Slight Decline
How do registered voters think Mayor Bloomberg is doing in office? 46% give the mayor high marks. This includes 12% who think Bloomberg is doing an excellent job in office and 34% who believe he is doing a good one. 32% rate the mayor’s performance as fair while 21% give Bloomberg poor marks. One percent is unsure.
In February’s survey, 50% approved of Bloomberg’s job performance. 32% thought he was doing a mediocre job while 16% said he fell short. Two percent, then, were unsure.
Table: Bloomberg Approval Rating
Table: Bloomberg Approval Rating Over Time
A City on Track, Says Majority
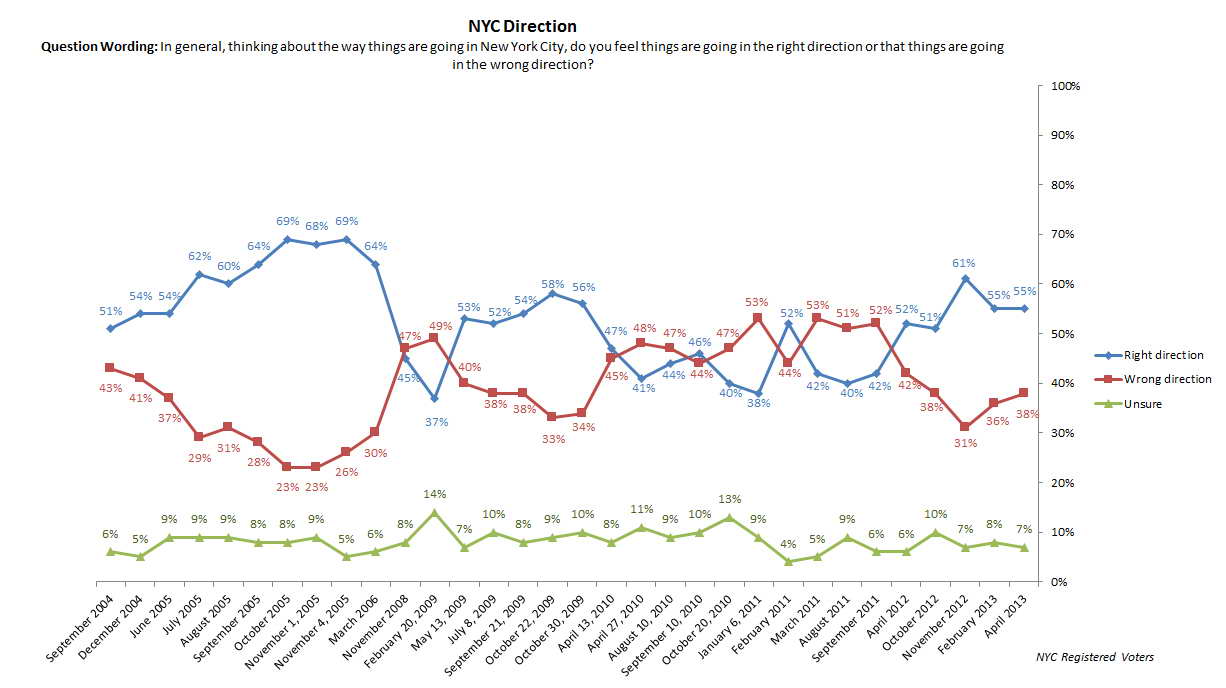
55% of registered voters in New York City think the Big Apple is moving in the right direction. 38% believe it is traveling on the wrong road, and 7% are unsure. In Marist’s February survey, 55% thought the city was on the right path. 36% reported it needed a course correction, and 8% were unsure.
Table: New York City Direction
Table: New York City Direction Over Time


