April 15, 2014
4/15: Ukraine in U.S. Interest, but Most Oppose Use of Force
McClatchy/Marist National Poll
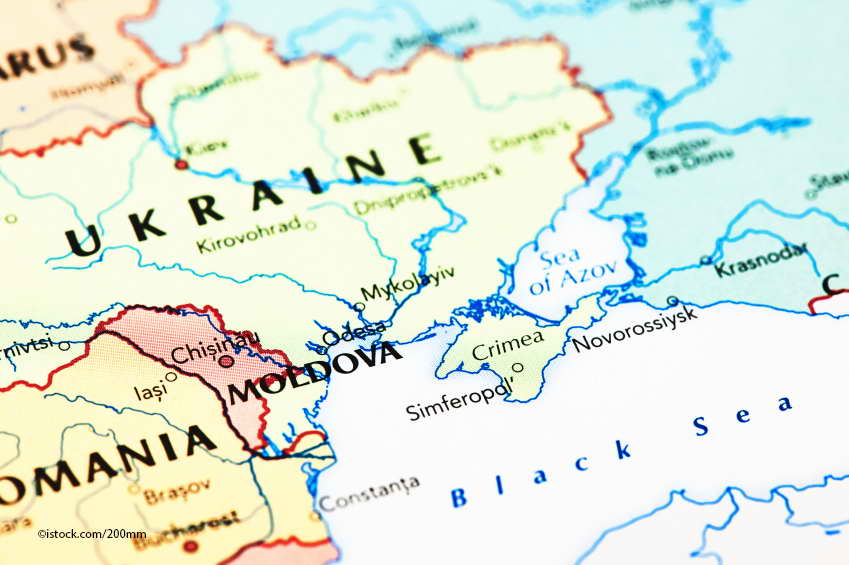
A majority of Americans — 55% — considers Ukraine to be key to the national interest. This includes 13% who say it is very important and 42% who consider it to be important. 39%, however, report it is either not very important — 30% — or not important at all — 9% — to the United States. Six percent are unsure.

Click Here for Complete April 15, 2014 USA McClatchy-Marist Poll Release and Tables
POLL MUST BE SOURCED: McClatchy-Marist Poll
“There is a good deal of ambivalence about Ukraine as far as U.S. public opinion is concerned,” says Dr. Lee M. Miringoff, Director of The Marist College Institute for Public Opinion. “Americans think it’s important to the national interest, and Russia may expand the conflict. But, there is little public consensus in the U.S. to take a tough stand.”
Regardless of political party, a majority thinks Ukraine is of consequence to America’s interests. Republicans, however, are the most likely to feel this way. 61% of Republicans say Ukraine is either very important or important to the United States. This compares with 52% of Democrats and 53% of independent voters who have the same opinion.
There are gender differences on this question. Six in ten women — 60% — say the region is of value to the United States. 48% of men say the same.
However, when it comes to whether or not the United States should draw a hard line against Russia because of Ukraine, half of residents — 50% — do not think the United States should take such a firm stance because it could mean losing Russia’s cooperation on other issues like Iran and Syria. 42% disagree and report America should take a tough stand against Russia. Eight percent are unsure.
What, if anything, should the United States do to address the situation in Ukraine? Only 7% of Americans think military options should be considered. 46% say the best way to deal with the crisis in Ukraine is through economic and political means, and 43% think the United States should not get involved at all. Four percent are unsure.
A majority of Republicans — 54% — wants America to handle the situation diplomatically. A plurality of Democrats — 47% — says the United States should stay out of the situation entirely while 43% believe the best options are political and economic. Nearly half of independent voters — 48% — say America should address the situation through non-military measures.
Table: Importance of Ukraine to the National Interest of the United States
Table: Should the United States Draw a Hard Line Against Russia in Ukraine?
Table: How the United States Should Handle the Situation in Ukraine
About Two-Thirds Say Russia will Send Troops Beyond Crimea…Divide about Possibility of New Cold War
66% of Americans think Russia will not stop at Crimea and will deploy troops to other parts of Ukraine. One in four — 25% — thinks Russia will keep its word and will stop at Crimea. Nine percent are unsure.
Do residents think the situation in Ukraine will lead to another cold war between the United States and Russia? Americans divide. 49% report it is either not very likely — 37% — or not likely at all — 12% — that this will occur. 46%, however, think a second cold war is either very likely — 13% — or likely — 33%.
Republicans are more likely than Democrats to think another cold war is looming. A majority of Republicans — 54% — says a cold war is very likely or likely to take place. This compares with 41% of Democrats and 45% of independent voters who share this view.
Table: Will Russia Send Troops to Other Regions of Ukraine?
Table: Likelihood the Situation in Ukraine will Lead to Another Cold War
Obama’s Handling of Ukraine Crisis Receives Mixed Reviews
45% of Americans approve of how President Barack Obama is dealing with the situation in Ukraine. 45% disapprove, and 10% are unsure.
There is a partisan divide. 72% of Republicans are dissatisfied with how the president is addressing the situation in Ukraine while 69% of Democrats approve. Still, 21% of Democrats disapprove of the way Mr. Obama is handling the conflict. Independents divide. 46% of these voters think the president is dealing with the situation appropriately while 47% disapprove of his approach.
Table: President Obama’s Handling of the Situation in Ukraine
Majority Still Disapproves of Obama’s Performance as President
When it comes to the overall job performance of President Obama, a majority of registered voters nationally — 52% — disapproves of how the president is doing. 45% approve, and 3% are unsure. These views are similar to those in McClatchy-Marist’s previous survey. In February, 52% of voters thought the president’s job performance was lacking. 42% gave him high marks, and 5% were unsure.
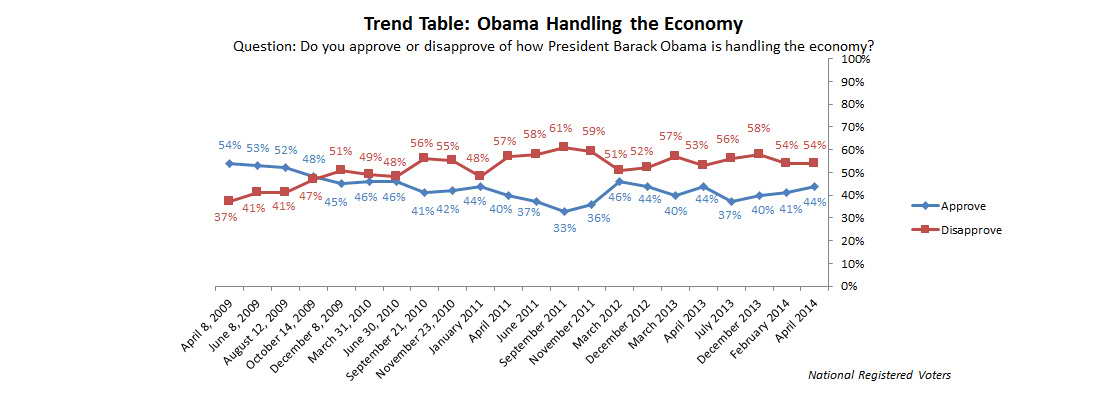
When it comes to how President Obama is handling the economy, a majority of voters — 54% — disapproves. 44% approve, and 2% are unsure. Last time, 54% thought Mr. Obama fell short on the economy while 41% gave him a thumbs-up. Five percent were unsure.
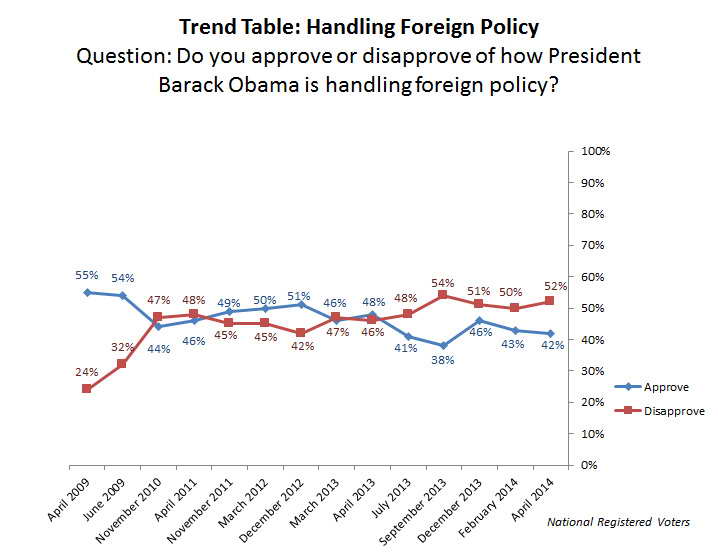
In the foreign policy arena, 52% of voters disapprove of how the president is doing. 42% approve, and 6% are unsure. Two months ago, 50% disapproved of how President Obama was handling foreign policy. 43% approved, and 8%, then, were unsure.
Looking at President Obama’s image, voters divide. 49% have a favorable opinion of him while 49% have an unfavorable view of him. Two percent are unsure how to rate him. In February, 47% thought well of the president while half — 50% — had a lesser view of him. Three percent were unsure how to rate him.
Table: President Obama Approval Rating
Table: President Obama Approval Rating (Over Time)
Table: President Obama’s Handling of the Economy
Table: President Obama’s Handling of the Economy (Over Time)

Table: President Obama’s Handling Foreign Policy
Table: President Obama’s Handling Foreign Policy (Over Time)

Table: President Obama Favorability
Table: President Obama Favorability (Over Time)

Fight for Congress: Dem’s Edge GOP in Generic Midterm Matchup
If November’s election for Congress were held today, the Democrats would have an edge over the Republicans as far as the total national vote is concerned. Nearly half of registered voters nationally — 48% — would support the Democrat on the ballot in their district while 42% would back the Republican candidate. Four percent would vote for neither, and 6% are undecided.
When McClatchy-Marist last reported this question in February, voters divided. 46% favored the Democrat while 44% were for the Republican. Four percent reported they would not vote for either candidate, and 5% were undecided.
Not surprisingly, there is a partisan divide. Most Democrats — 90% — favor the Democratic candidate while most Republicans — 94% — support the Republican. Among independent voters, 43% are for the Democrat while 40% are for the Republican.
Neither the Democrats nor the Republicans in Congress are held in high regard by voters. Only 32% of registered voters approve of how the congressional Democrats are doing in office. 63% disapprove, and 5% are unsure. In February, 33% of voters were satisfied with how the Democrats were performing in Congress. 60% disapproved, and 7% were unsure.
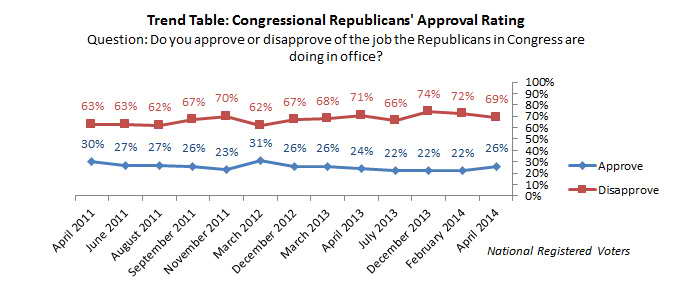
Looking at congressional Republicans, 26% of voters approve of their job performance while 69% disapprove. Five percent are unsure. In the February McClatchy-Marist Poll, 22% approved of how the congressional GOP did their job. 72% disapproved, and 6% were unsure.
Table: 2014 Congressional Elections
Table: Congressional Democrats’ Approval Rating
Table: Congressional Democrats’ Approval Rating (Over Time)

Table: Congressional Republicans’ Approval Rating
Table: Congressional Republicans’ Approval Rating (Over Time)
Nearly Two-Thirds Pessimistic about the Direction of the Nation
64% of adults think the country is moving in the wrong direction. 32% believe it is on the right path, and 3% are unsure. There has been virtually little change from McClatchy-Marist’s previous survey. In February, 64% of residents reported the nation was on the wrong road. 33% said it was on the right track, and 3% were unsure.
Table: Right or Wrong Direction of the Country
Table: Right or Wrong Direction of the Country (Over Time)


