February 3, 2011
2/3: Bloomberg Approval Rating Has Edged Up to 44%
Mayor Michael Bloomberg’s job approval rating may have dipped in the aftermath of the December 26th blizzard, but his rating is now on the mend. More than four in ten registered voters citywide — 44% — approve of the job Bloomberg is doing in office. This includes 10% who say the mayor is doing an excellent job and 34% who report he is doing a good one. About three in ten — 29% — rate his performance as fair, and 26% say he is doing poorly. Just 1% is unsure.
Click Here for Complete February 3, 2011 NYC NY1/YNN-Marist Poll Release and Tables
When NY1-Marist last reported the mayor’s job approval rating in early January, 37% of voters gave the mayor high marks. 34% thought he was doing a fair job, and 26% believed he was performing poorly. Three percent were unsure.
“Mayor Bloomberg still lacks majority support, but seems to be weathering the storm,” says Dr. Lee M. Miringoff, Director of The Marist College Institute for Public Opinion.
Mayor Bloomberg continues to struggle in the Bronx where 38% of voters currently approve of his job performance. Last month, 39% shared this view. And, although the mayor enjoys a bump in his approval rating in Brooklyn, his rating is still low. 38% of voters in Brooklyn rate Bloomberg’s job performance as above average while 24% thought that way in NY1-Marist’s last survey. In Manhattan, half approve of the mayor’s job performance while 55% had this opinion last month. Nearly half of voters in Queens and Staten Island — 49% — now give Bloomberg kudos while 36% did the same in NY1-Marist’s previous survey.
Table: Mayor Michael Bloomberg Approval Rating
Table: Mayor Michael Bloomberg Approval Rating Over Time
Majority See City as Back on Track
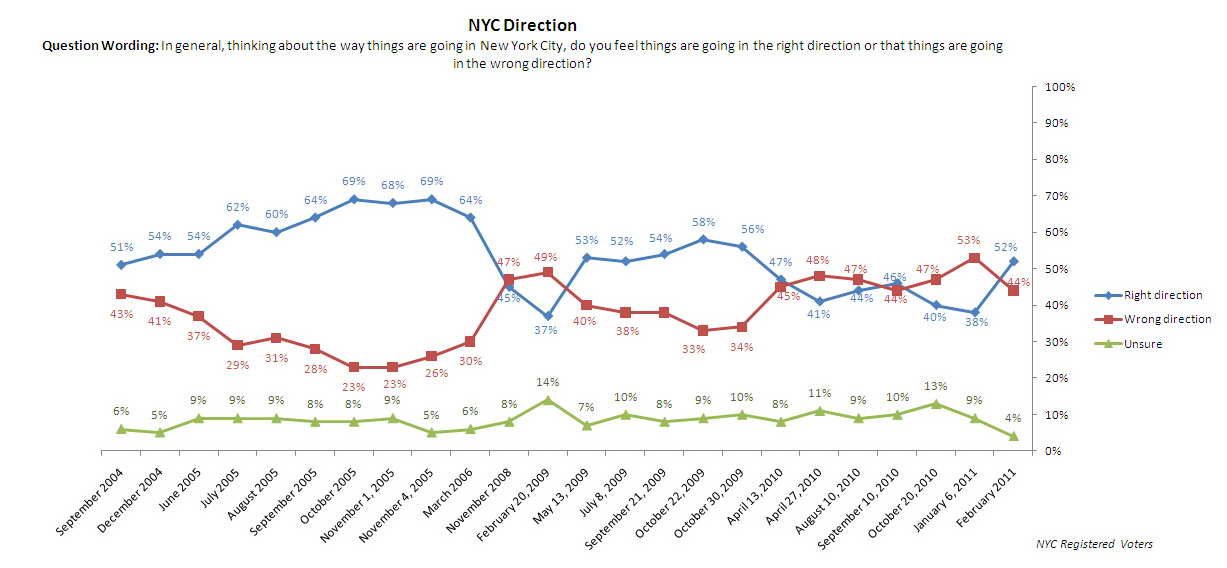
For the first time since October of 2009, a majority of voters think the city is headed in the right direction. 52% currently view the city as moving on the right path while 44% report it is traveling in the wrong direction. Four percent are unsure.
When NY1-Marist last asked this question in early January, a majority — 53% — said the Big Apple was moving in the wrong direction while 38% said it was on the correct road. Nine percent, at the time, were unsure.
Table: New York City Direction
Table: New York City Direction Over Time
Black Off to a Blue Start as Schools Chancellor
New York City Schools Chancellor Cathie Black has her work cut out for her. About one in five registered voters — 21% — think she is doing either an excellent or good job in her new role. Included here are just 2% who believe she is doing an excellent job and 19% who say she is doing a good one. Slightly more than one-third — 35% — rate her performance thus far as fair while 19% say she is doing poorly. A notable 26% have either never heard of her or are unsure how to rate her.
Table: New York City Schools Chancellor Cathie Black Approval Rating
Most NYC Voters Want Changes to Union Wage Contracts
Most New York City voters are taking a tough stand on pay raises for union workers. Just 23% believe workers, including teachers and health care workers, should receive increases like the ones they have gotten in the past. Nearly four in ten — 38% — report wage increases should be based on merit or performance when their contracts come due, and an additional 27% want union workers to be paid a cost of living increase but nothing else. Eight percent don’t think they should get any increase in pay. Five percent are unsure.


