September 23, 2016
9/23: Clinton Leads Trump by 7 Points Nationally
McClatchy/Marist National Poll
With just days until the first presidential debate, Democrats Hillary Clinton and Tim Kaine lead Republicans Donald Trump and Mike Pence by 7 points among likely voters nationally including those who are undecided yet leaning toward a candidate. Eight percent of likely voters say they do not support either Clinton or Trump, and 1% report they are for someone else. Two percent are undecided.
“Hillary Clinton has established a lead, but Donald Trump’s supporters are more committed to him,” says Dr. Lee M. Miringoff, Director of The Marist College Institute for Public Opinion. “Digging deeper, African Americans, Latinos, and women are rallying around Clinton’s candidacy. She also has the backing of young people, but the big question for her campaign is, ‘Will voters under 30 turn out?’”
Clinton and Trump overwhelmingly carry their respective party’s base. However, more Democrats, 94%, support Clinton than Republicans, 87%, back Trump. Clinton, 40%, and Trump, 38%, receive similar support among independents who are likely to vote. A notable 18% of independents say they will not support either Clinton or Trump.
Clinton’s support is bolstered by African Americans and Latinos who are likely to vote. Most African Americans, 93%, are for Clinton while only 3% of African American voters support Trump. Among Latino voters, Clinton, 74%, outdistances Trump, 16%, by more than four to one. Trump’s support is substantiated by likely voters who are white, 53%, especially those without a college degree, 60%. Among white voters with a college education, Clinton, 45%, and Trump, 44%, are competitive. A gender gap exists. 58% of likely voters who are women support Clinton compared with 34% who back Trump. 50% of men are for Trump while only 37% support Clinton.
Looking at intensity of support, 65% of likely voters with a candidate preference say they strongly support their choice for president, and an additional 27% report they somewhat support their selection. Trump’s backers, 69%, are slightly more likely than Clinton’s supporters, 62%, to say they will not waver in their commitment to their choice.
However, Trump’s supporters are divided about why they are choosing to back him. 48% of those who plan to vote for Trump say they will do so because they are for him. A similar 47% say they are motivated to vote for Trump because they are against Clinton. In comparison, a majority of likely voters who back Clinton, 53%, say they plan to cast their ballot because they are for her. 43% assert they support Clinton because they are against Trump.
Clinton and Trump experience upside down favorable scores among likely voters nationally. Clinton’s net negative is 17 points. 57% have an unfavorable view of Clinton while 40% have a favorable opinion of her. Trump experiences a net negative of 24 points. 61% of residents have an unfavorable impression of Trump while 37% have a favorable one.
Looking at the multi-field contest for President of the United States, Clinton, 45%, leads Trump, 39%, by 6 points among likely voters nationally including those who are undecided yet leaning toward a candidate. Libertarian candidate Gary Johnson has the support of 10% while Green Party candidate Jill Stein garners 4%. Of note, Johnson receives the backing of 20% of independents who are likely to vote.
79% of likely voters nationally think it makes a big difference whether Hillary Clinton or Donald Trump is elected president. 14% say it makes some difference, and 6% believe it makes no difference at all. Similar proportions of Clinton’s supporters, 83%, and Trump’s backers, 81%, believe the stakes of this election are high.
Jobs and the economy is the leading issue for voters. 34% of likely voters say it is the key factor in deciding their vote. Terrorism, health care, and education follow, each with 12%. Nine percent cite foreign policy, an additional 9% mention immigration, and 5% report taxes. Two percent of likely voters say another issue is most important in deciding their vote for president, and 4% are unsure.
Jobs and the economy tops the list for both Clinton’s backers, 34%, and Trump’s supporters, 37%. However, education, 18%, and health care, 16%, place second and third, respectively, among likely voters for Clinton. Among likely voters for Trump, terrorism, 22%, is the second most mentioned issue. Immigration distantly follows with 12% of Trump’s supporters saying it is the issue about which they are most concerned.
“Jobs and the economy is the number one issue. Where have we heard that one before?” asks Dr. Lee M. Miringoff, Director of The Marist College Institute for Public Opinion. “But, for Clinton’s supporters other domestic issues rate high such as education and health care. For Trump’s backers, terrorism and immigration are top of mind.”
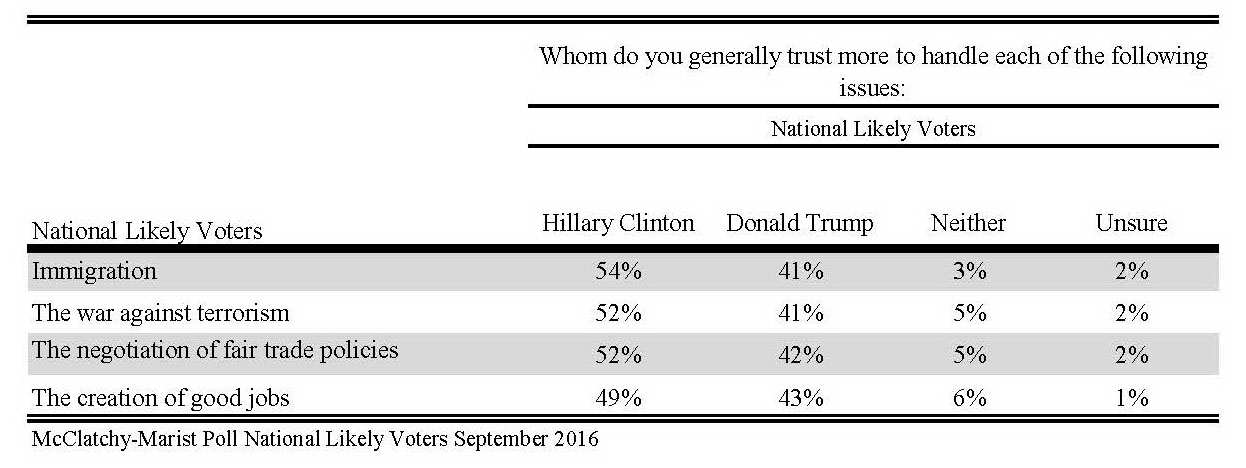
When it comes to the candidate likely voters trust more to handle the issues facing America, Clinton outpaces Trump. She scores highest on immigration with 54% of likely voters saying they have more confidence in her ability compared with 41% who think Trump will better deal with the issue. Fewer voters believe in Clinton on the economy. Still, more voters trust her to make headway in this area than have faith in Trump. 49% of likely voters nationally trust Clinton to better handle jobs and the economy compared with 43% who have this view of Trump.
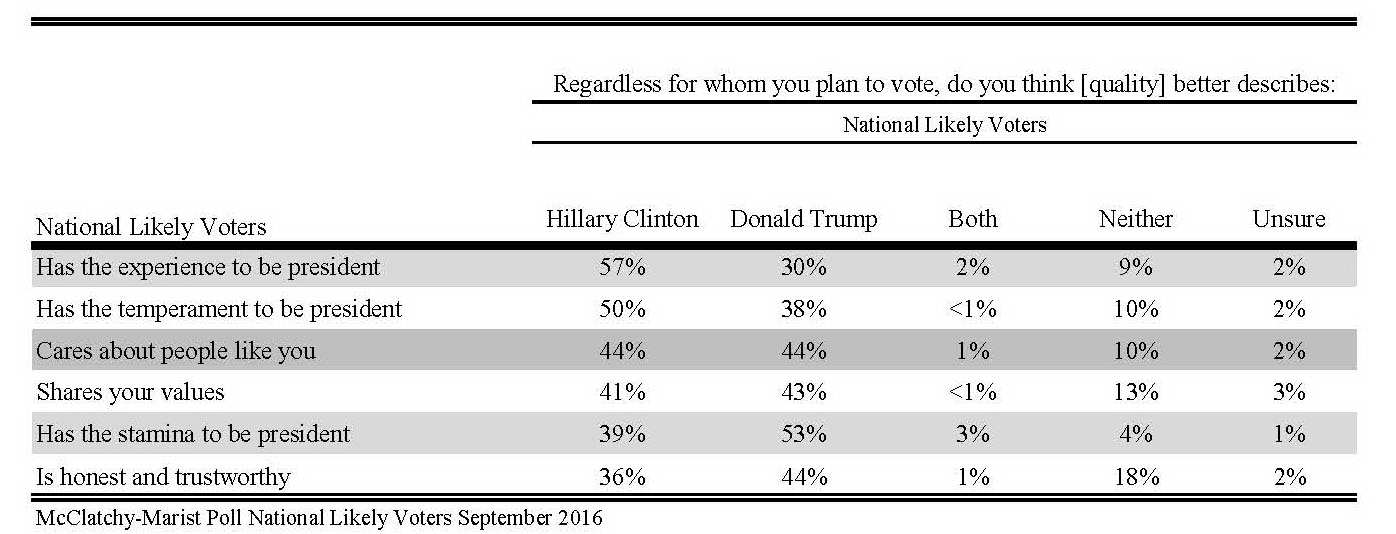
Clinton is perceived by likely voters as the candidate with the experience to be president, 57%. Voters are also more likely to describe Clinton, rather than Trump, as the candidate with the temperament to be president, 50%. Trump, though, is viewed as the candidate with the stamina to be president, 53%. On the question of which candidate is honest and trustworthy, Trump, 44%, outperforms Clinton, 36%. Of note, 18% of the likely electorate say neither candidate can be described in this manner. The likely electorate divides about which candidate is more likely to care about the average person or to share their values.
Turning to the generic ballot for Congress, 49% of likely voters nationally say they would support the Democratic candidate in their district while 45% would back the Republican. Two percent would not support either of the main party candidates, and 3% are undecided.
President Barack Obama enjoys a 52% approval rating among registered voters nationally. This is similar to the 53% he garnered in August. 43% currently disapprove of the job the president is doing in office, and 5% are unsure. Among likely voters nationally, the president’s job approval rating stands at a similar 51%.
While Americans may be upbeat about President Obama’s job performance, they remain pessimistic about the direction of the nation. 59% of residents report the nation is moving in the wrong direction while 34% say it is traveling in the right one. These proportions are identical to those in the August McClatchy-Marist Poll. Among likely voters nationally, 59% currently believe the nation is off course while 35% report it is on track.
Complete September 23, 2016 McClatchy-Marist Poll Release of the United States
Complete September 23, 2016 McClatchy-Marist Poll of the United States (Tables of Likely Voters)


