
September 11, 2016
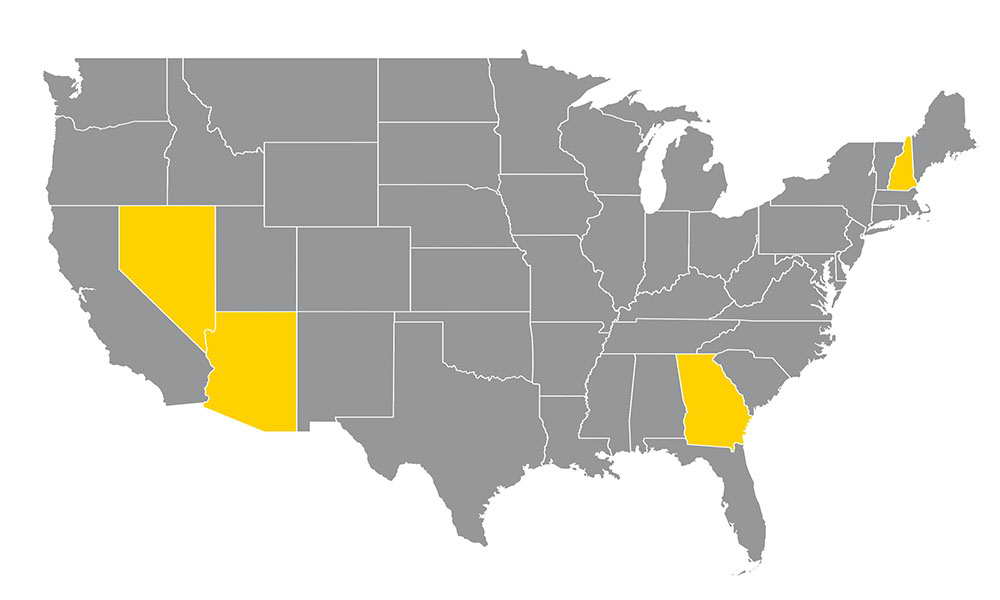
9/11: Trump vs. Clinton in Arizona, Georgia, Nevada, and New Hampshire
NBC News/WSJ/Marist Poll
With a combined 37 electoral votes hanging in the balance in Arizona, Georgia, Nevada, and New Hampshire, Democrats Hillary Clinton and Tim Kaine and Republicans Donald Trump and Mike Pence are highly competitive among likely voters in each state including voters who are undecided yet leaning toward a candidate. This is in contrast with 2012 when Republican nominee Mitt Romney secured both Arizona’s and Georgia’s electoral votes, and President Barack Obama carried Nevada and New Hampshire in both of his victories for the White House. In 2012, each candidate carried their respective states by wider margins than Clinton and Trump are currently able to achieve.

“As we enter the final lap of this very unconventional election, it would not be surprising if the electoral map, in the end, has new contours,” says Dr. Lee M. Miringoff, Director of The Marist College Institute for Public Opinion. “Any of these four states could awaken a fault line in what is looking more and more like a shake-up election with more states being up for grabs.”
In Arizona, Trump receives 42% to 41% for Clinton among likely voters statewide. More than six in ten likely voters with a candidate preference, 63%, say they strongly support their choice of candidate. Among Arizona likely voters who support Trump, 65% report they are firmly committed to him. 62% of Clinton’s backers report a similar level of support for her.
Looking at the multi-candidate contest in Arizona including Libertarian Gary Johnson and Green Party candidate Jill Stein, 40% of the likely electorate support Trump compared with 38% for Clinton. 12% support Johnson, and 3% are for Stein.
In Georgia, 46% of likely voters back Trump while Clinton receives the support of 43%. 66% of likely voters with a candidate preference say they strongly support their choice of candidate. Looking at intensity of support among the candidates’ backers, 66% of Trump’s supporters say they will not waver in their commitment to him. 67% of Clinton’s supporters express the same intensity of support toward her.
How do Trump and Clinton fare in a larger field of candidates in Georgia? 44% of likely voters statewide are for Trump while 42% are for Clinton. Johnson receives the support of 10%. Voters have the opportunity to write in Stein’s name although she is not currently on the ballot in Georgia.
Nevada is also a tossup. Only one point separates the two contenders. When matched only against each other, Clinton is at 45%, and Trump garners 44% among likely voters statewide. 70% of likely voters with a candidate preference report they strongly support their choice. 71% of likely voters who are behind Trump and 70% of those for Clinton are firmly committed to their candidate selection. In a four-way contest, 42% of likely voters are for Trump while 41% are for Clinton. Eight percent support Johnson, and 3% back Stein.
In New Hampshire, Clinton, 42%, is closely matched with Trump, 41%, among likely voters statewide. 65% of likely voters with a candidate preference assert they are strongly behind their choice. Here, 68% of likely voters who support Clinton, compared with 62% of Trump’s backers, say they will not change their minds before Election Day.
When Johnson and Stein are included in the mix, Clinton garners 39% of the New Hampshire likely electorate to 37% for Trump. 15% of likely voters in New Hampshire are for Johnson while 3% are for Stein.
In both two-way and multi-candidate matchups, likely voters move the presidential contest more Republican except in New Hampshire. This is primarily due to the increase in the proportion of white voters within the likely electorates of Arizona, Nevada, and Georgia. This is accompanied by the decline of Latino voters in the likely electorates of Arizona and Nevada and minority voters, overall, in Georgia.
Both Clinton and Trump have strong support from their respective party’s base in each of these four states. Among independents who are likely to vote, Clinton and Trump are competitive. Of note, more than one in ten independents in each of these states reports they do not support either candidate. In fact, in New Hampshire, 19%, Georgia, 17%, and Arizona, 17%, nearly one in five independents reports they plan not to support either of the two major party candidates. 11% of independents in Nevada share this view.
In patterns that have been seen in other states, a voter’s gender or education makes a difference. Clinton leads Trump among women while Trump is ahead of Clinton among men. Trump outperforms Clinton among white voters without a college degree. At least a majority of these voters support Trump in all four states. Clinton performs better among white voters with a college degree. She leads Trump among this group in New Hampshire. Clinton and Trump are competitive among these voters in Nevada and Arizona. However, Clinton trails Trump by a wide margin even among white voters with a college education in Georgia.

Clinton and Trump are disliked by the electorates in each of these state. Their favorable scores are upside down. In Arizona, Georgia, Nevada, and New Hampshire, a strong majority of likely voters say they have a negative impression of Clinton or a negative opinion of Trump.
“In fact, the electorate is so turned off by these candidates that about one in five likely voters in these states have a hate-hate view of both of them,” says Dr. Lee M. Miringoff, Director of The Marist College Institute for Public Opinion. “In Arizona, 24%, New Hampshire, 23%, Georgia, 18%, and Nevada, 16%, notable proportions of likely voters have a negative impression of both Clinton and Trump.”


Turning to the down ballot races, in the contest for U.S. Senate in Arizona, Republican incumbent John McCain, 57%, has a commanding lead over his Democratic challenger Ann Kirkpatrick, 38%, among likely voters statewide including those who are undecided yet leaning toward a candidate. 53% of the state’s likely electorate with a candidate preference say they are firmly committed to their choice for U.S. Senate in Arizona.
In Georgia, Republican incumbent Johnny Isakson, 53%, is well out in front of his Democratic challenger Jim Barksdale, 38%, by 15 points among likely voters statewide including those who are undecided yet leaning toward a candidate. 59% of likely voters with a candidate preference report they strongly support their pick for U.S. Senate in Georgia.
In the contest to fill the seat of Nevada Senator Harry Reid, Republican Joe Heck, 47%, and Democrat Catherine Cortez Masto, 45%, are closely matched among likely voters in their state including those who are undecided yet leaning toward a candidate. Looking at likely voters’ intensity of support, 58% of those with a candidate preference are firmly behind their choice for U.S. Senate in Nevada.
In New Hampshire, Republican incumbent Senator Kelly Ayotte, 52%, leads her Democratic challenger Maggie Hassan, 44%, among likely voters statewide including those who are undecided yet leaning toward a candidate. 64% of those with a candidate preference say they are strongly committed to their selection for U.S. Senate in New Hampshire.
“Democratic hopes of picking up a Senate seat in New Hampshire are in jeopardy as is their chance of holding Senator Harry Reid’s seat in Nevada,” says Dr. Lee M. Miringoff, Director of The Marist College Institute for Public Opinion.
Looking at a generic ballot for New Hampshire governor, 47% of likely voters are for the Republican candidate while 43% are for the Democratic candidate.
President Barack Obama’s job performance receives mixed reviews. 48% of residents in Arizona approve of how the president is performing in office while 44% disapprove. Mr. Obama receives similar scores in Nevada where 47% think well of how he is doing his job while 43% disapprove. Georgia and New Hampshire residents divide. In New Hampshire, 47% of adults have a positive impression of how President Obama is doing his job while 46% consider the president’s performance in office to be lacking. In Georgia, 47% of adults approve of President Obama’s job performance, and 45% disapprove. Among likely voters, the president’s job approval rating is upside down in all four states.
“Voters’ assessment of President Obama’s job performance in all four of these states is below what national polls are showing,” says Dr. Lee M. Miringoff, Director of The Marist College Institute for Public Opinion. “Passing the Democratic baton to Clinton may be easier elsewhere.”
Marist Poll Methodology for Arizona
Nature of the Sample for Arizona
Marist Poll Methodology for Georgia
Nature of the Sample for Georgia
Marist Poll Methodology for Nevada
Nature of the Sample for Nevada