August 9, 2011
8/9: Nation’s Direction Takes Sharp Turn for the Worse
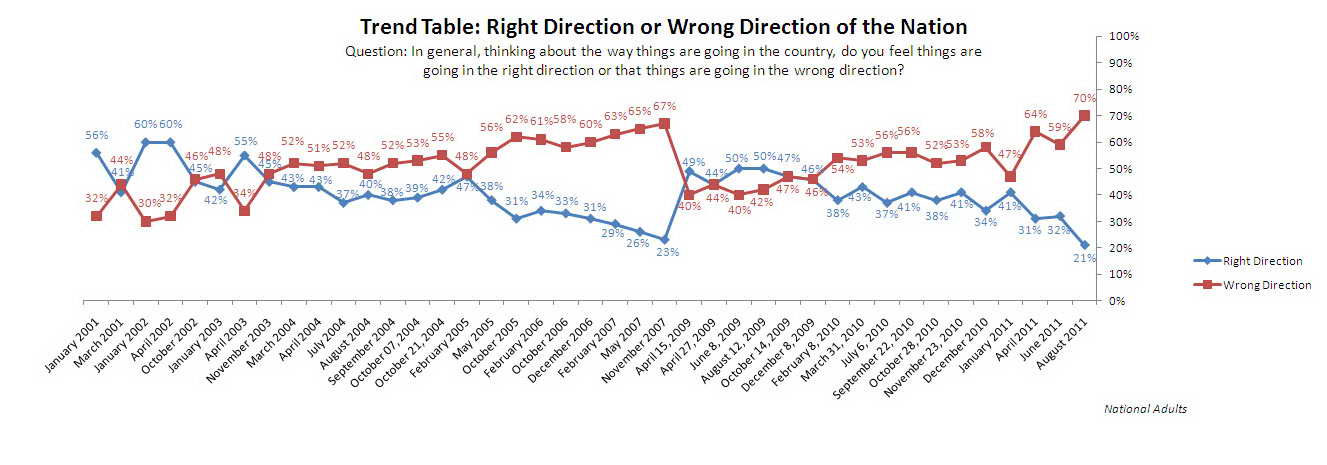
Americans’ views toward the future of the country have become increasingly negative. According to this McClatchy-Marist Poll, seven in ten U.S. residents — 70% — believe the nation is moving in the wrong direction while only 21% say it is traveling along the right one. One in ten — 10% — is unsure.
Click Here for Complete August 9th, 2011 USA McClatchy-Marist Poll Release and Tables
There has been a major change on this question since McClatchy-Marist last reported it in June. At that time, 59% thought the country was on the wrong track while 32% said it was on the right one. Nine percent, at that time, were unsure.
The current proportion of Americans who report the nation needs its course corrected is the largest since President Barack Obama took office in January of 2009 and the worst in more than a decade.
“It’s getting harder and harder for Washington to have a tin ear to Americans who are clamoring about the direction of the nation,” says Dr. Lee M. Miringoff, Director of The Marist College Institute for Public Opinion. “Republicans are the most negative in their views. But, Democrats and independents have increasingly soured to the direction of the country.”
Looking at registered voters, the largest change has occurred among Democrats and independent voters.
- 72% of registered voters view the nation as going downhill while 21% perceive it as on the right track. Just 7% are unsure.
- 54% of Democrats now report the country is moving in the wrong direction. 37% said the same in June.
- Among independents, nearly eight in ten — 78% — believe the nation’s trajectory is negative while 62% thought the same in McClatchy-Marist’s previous survey.
- 88% of Republicans currently think the nation is on the wrong path, little changed from 87% in June.
Table: Right or Wrong Direction of the Country
Table: Right or Wrong Direction of the Country (Over Time)
Plurality Denounces Debt Deal
The debate over whether or not to raise the nation’s debt ceiling has dominated political debate for most of the summer. How do Americans assess the agreement? A plurality of Americans — 47% — characterizes it as bad for the nation while 41% believe the deal, overall, is good for America. 12% are unsure.
Among registered voters:
- 47% report the agreement is bad for the country while 43% say it is a good thing. One in ten — 10% — is unsure.
- 63% of Republicans and 49% of independents think the debt deal is bad for the country.
- A majority of Democrats — 56% — believe it is good for the nation.
On the specifics of the debt ceiling deal, about two-thirds of Americans — 66% — think the agreement’s approach is unbalanced. Almost one in five — 19% — believe the deal is balanced, and 14% are unsure.
Registered voters have similar views. 68% of registered voters say the agreement is out of balance while one in five — 20% — report it is balanced. 12% are unsure. Independent voters tip the scale on this question. 72% of independents say the debt deal is not balanced. This compares with 67% of Republicans and 64% of Democrats.
But, who do Americans believe will benefit from the deal, and who will carry the burden?
Key points:
- 65% of residents nationwide think the deal is unfair to the elderly. 26% say it is fair, and 9% are unsure.
- More than six in ten residents — 62% — think the deal is unfair to the poor. 28% disagree, and 10% are unsure.
- About six in ten adults — 61% — believe the agreement shortchanges the middle class. 29% believe the deal is fair, and 10% are unsure.
- However, a majority of U.S. adults — 55% — say the debt ceiling agreement is fair to Americans with high incomes. 34% call it unfair, and 11% are unsure.
- A majority also believes the agreement is fair to Corporate America. 54% of residents have this view. 31% think the opposite is true, and 15% are unsure.
Table: Is the Debt Ceiling Agreement Good or Bad for the Nation?
Table: Is the Debt Deal Balanced or Not Balanced?
Table: Is the Debt Deal Fair or Unfair to the Elderly?
Table: Is the Debt Deal Fair or Unfair to the Poor?
Table: Is the Debt Deal Fair or Unfair to the Middle Class?
Table: Is the Debt Deal Fair or Unfair to Americans with High Incomes?
Table: Is the Debt Deal Fair or Unfair to Corporate America?
Debt Deal Fallout
More than three in four adults nationally — 77% — say the debt ceiling debate has made them less confident in government in Washington. 79% of registered voters agree. Just 15% of U.S. residents say the political wrangling has given them increased confidence in the federal government, and 9% are unsure.
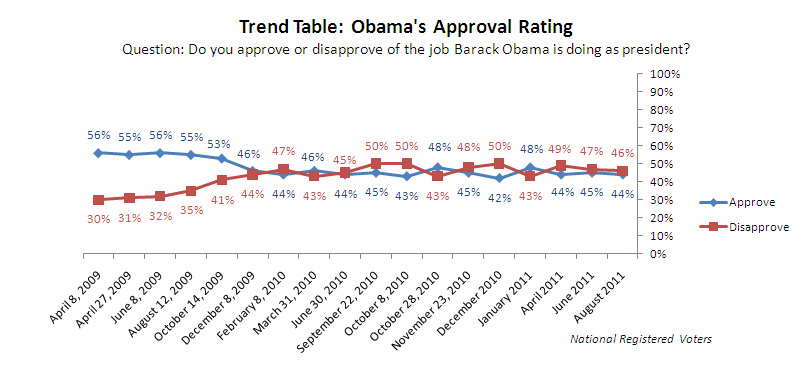
Despite the debt ceiling debate, President Obama’s job performance has changed little. 44% of registered voters approve of the job he is doing while 46% disapprove. One in ten — 10% — is unsure. In McClatchy-Marist’s June survey, 45% approved of how the president was performing in office while 47% disapproved. Eight percent, at the time, were unsure.
The job approval rating of Republicans in Congress still lags behind that of the president, but it has changed little over the past few weeks. More than six in ten registered voters — 62% — still disapprove of their job performance while only 27% approve. 11% are unsure. In June, those proportions stood at 63%, 27%, and 10%, respectively.
Even 44% of Republican voters disapprove of how members of their own party are doing in Congress.
Looking at the Democrats in Congress, a majority — 55% — of registered voters disapprove of the job they are doing. 35% approve, and 11% are unsure. In June, 60% gave the Democrats in Congress poor marks while 30% rated them well. 10% were unsure.
Is President Obama too liberal, too conservative, or about right? 48% believe President Obama is ideologically positioned about right. More independent voters think the president’s ideology is on track than believe the same about the Republicans and Democrats in Congress.
Key points:
- 48% of registered voters say President Obama is neither too liberal nor too conservative. 36% perceive the president as too liberal while 7% think he is too conservative. Eight percent are unsure.
o Not surprisingly, 71% of Democrats perceive the president’s ideology to be about right while 71% of Republicans think he is too liberal. 46% of independents believe Mr. Obama’s ideology is on target.
- When it comes to Republicans in Congress, 41% of registered voters say they are too conservative while 31% think they are about right. 17% call them too liberal. 11% are unsure.
o Only 29% of independent voters say the Republicans in Congress are on track. 40% believe they are too conservative.
- 42% of voters believe Democrats in Congress are too liberal. 36% say their ideology is on the mark while 12% report they are too conservative. One in ten — 10% — is unsure.
o Among independent voters, 35% describe the ideology of Democrats in Congress as about right. 40% believe they are too liberal.
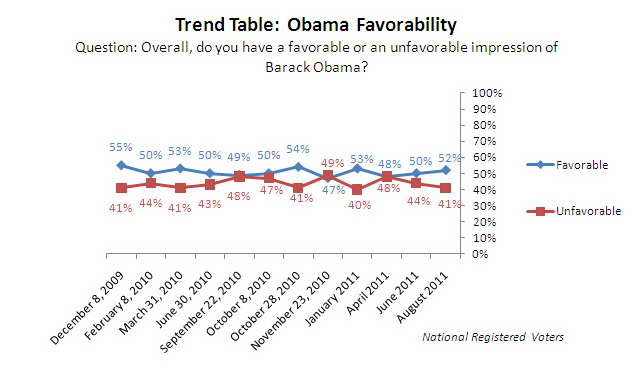
Is the president still perceived as likeable? 52% of registered voters view President Obama favorably. 41% have a less than stellar impression of him, and 8% are unsure.
Little has changed on this question since McClatchy-Marist last reported it in June. At that time, half — 50% — thought well of the president, 44% had a lesser impression of Mr. Obama, and 6% were unsure.
And, what about the Tea Party? 31% of Americans say it played a major role in shaping the debt deal, about one-third — 33% — think the movement played a minor role, and 19% believe it played no role at all. 17% are unsure.
Nearly three in ten registered voters — 29% — still identify with the Tea Party compared with 25% who did so in June.
Among registered voters who support the Tea Party, 34% think the movement played a major role in shaping the deal. 46% believe it had a minor role, and 15% say it played no part at all. Six percent are unsure.
When it comes to electoral politics, the message registered voters are sending to candidates who plan to run for Congress next year depends on their political allegiance. Among registered voters overall, 41% say they are less likely to cast their ballot for a candidate who supported the debt ceiling deal while 36% report they are more likely to vote for such a candidate. 11% state that support for the debt ceiling agreement makes no difference to their vote, and 12% are unsure.
Key points:
- By party, a majority of Republican voters — 53% — report that a candidate’s backing of the agreement makes them less likely to support that candidate for Congress next year. 24% report it makes them more likely to do so. However, nearly half of Democrats — 47% — say support of the deal makes them more likely to back a candidate for Congress while 30% state it makes them less likely to cast their ballot for that candidate next year.
- Only 27% of those who support the Tea Party movement say a candidate’s support for the debt agreement makes them more likely to back that candidate. 61% report it makes them less likely while 6% say it makes no difference to their vote. Six percent are unsure.
Table: Debt Ceiling Agreement’s Impact on Confidence in Government
Table: President Obama Approval Rating
Table: President Obama Approval Rating (Over Time)
Table: Congressional Republicans’ Approval Rating
Table: Congressional Republicans’ Approval Rating (Over Time)
Table: Congressional Democrats’ Approval Rating
Table: Congressional Democrats’ Approval Rating (Over Time)
Table: President Obama’s Ideology
Table: Congressional Republicans’ Ideology
Table: Congressional Democrats’ Ideology
Table: President Obama Favorability
Table: President Obama Favorability (Over Time)
Table: Role of Tea Party in Shaping the Debt Ceiling Agreement
Table: Tea Party Supporters Over Time
Table: Impact of Debt Ceiling Support on 2012 Congressional Campaign
Round Two
When the budget talks resume, Americans expect a replay in the lack of cooperation between President Barack Obama and Congress. Seven in ten American adults — 70% — believe it will be about the same during the next round of deficit talks. 16% believe they will be less cooperative while 14% think they will be more cooperative.
Which actions do Americans support to pay down the debt? The direction of the debate in Washington is out of touch with what people want.
- Nearly seven in ten adults nationally — 68% — support increasing taxes on income over $250,000. 29% oppose such an action, and 3% are unsure.
o Similar proportions of registered voters share these views. 69% support raising income taxes on the wealthiest Americans, 28% oppose it, and 2% are unsure.
o Even 51% of Republicans and 43% of Tea Party supporters favor these tax increases.
- 60% of U.S. residents support eliminating oil subsidies for oil and gas companies while 33% oppose such an action. Seven percent are unsure.
- Half of Americans — 50% — back the reduction of defense spending while 46% do not want to cut the current level of spending. Four percent are unsure.
o The same proportions of registered voters — 50%, 46%, and 4%, respectively — have these views.
o 60% of Democrats back the reduction of defense spending while 63% of Republicans oppose such a cut.
- Most U.S. residents — 83% — are against cutting Medicare and Social Security. 15% disagree, and 3% are unsure.
o Among registered voters, the proportions are similar. 84% oppose reducing these benefits, 14% support such an action, and 2% are unsure.
o Even eight in ten Republican voters — 80% — and 74% of Tea Party supporters are against reducing Medicare and Social Security.
- There is also opposition to cutting Medicaid and entitlements. More than seven in ten Americans — 72% — are against reducing this area to pay down the debt while only 23% favor it. Four percent are unsure.
o There is little difference among registered voters nationally. 73% oppose slashing Medicaid and entitlements, 23% support it, and 4% are unsure.
o Even majorities of Republican voters — 58% — and Tea Party supporters — 53% — oppose cutting Medicaid and entitlements.
Table: Level of Cooperation During the Next Round of Budget Talks
Table: Support or Oppose Increasing Taxes on Income Over $250,000?
Table: Support or Oppose Eliminating Oil Subsidies for Oil and Gas Companies?
Table: Support or Oppose Reducing Defense Spending?
Table: Support or Oppose Cutting Medicare and Social Security?
Table: Support or Oppose Cutting Medicaid and Entitlements?
McClatchy-Marist Poll Methodology


