July 16, 2012
7/16: Obama and Romney Vie for Lead Nationally
McClatchy/Marist National Poll
In the battle for the White House, President Barack Obama and Mitt Romney are locked in a close contest nationally. According to this McClatchy-Marist Poll, 48% of U.S. registered voters including those who are undecided yet leaning toward a candidate support President Obama compared with 46% for Romney. Less than one percent backs another candidate, and 6% are undecided.
 Click Here for Complete July 16, 2012 USA McClatchy-Marist Poll Release and Tables
“The race was close yesterday, it’s close today, and may even be close on Election Day,” says Dr. Lee M. Miringoff, Director of The Marist College Institute for Public Opinion. “You need to look no farther than the president’s approval rating to see how divided the electorate is.”
Key points:
- Most Democrats — 85% — are for Obama while most Republicans — 89% — back Romney. Independent voters divide. Among this key voting block, 48% support Romney compared with 44% for Obama.
- 92% of those who describe themselves as strong Democrats are behind Obama. Among soft Democrats, registered voters who are not strong Democrats or Democratic leaning independents, the president loses some ground. Among these voters, 77% support Mr. Obama, and 15% are for Romney. Most strong Republicans — 92% — are for Romney. 83% of those who describe themselves as soft Republicans say the same.
- Voters who express a high level of enthusiasm about voting in the presidential election divide. 50% are for Obama compared with 47% for Romney. Obama — 52% — leads Romney — 43% — among voters who say they are moderately enthusiastic. Among those with a low degree of enthusiasm about voting, 47% support Romney compared with 38% for Obama.
- Among registered voters who strongly support their choice of candidate, Obama — 54% — is ahead of Romney — 46%.
- There is a generational divide. 74% of voters under the age of 30 rally for the president. This compares with 20% who favor Romney. Among those 30 to 44 years old, 49% support the president while 44% are behind Romney. Voters 45 to 59 divide. Among this group, 48% back Romney compared with 45% for Obama. Romney — 57% — leads Obama — 36% — among voters 60 and older.
- Gender matters. A majority of men — 52% are for Romney while 40% are for Obama. Among women, a majority — 55% — favor the president while 40% are behind Romney.
Table: 2012 Presidential Tossup (Registered Voters with Leaners)
More Than Seven in Ten Strongly Support Candidate
71% of registered voters nationally report they are firmly committed to their choice of candidate. 21% are somewhat behind their pick while 6% say they might vote differently on Election Day. Two percent are unsure.
Key points:
- 76% of Obama’s backers strongly support him. This compares with 67% of Romney’s supporters who have a similar intensity of support.
Nearly Three in Four Voters Enthusiastic to Vote
73% of registered voters nationally are enthusiastic to cast their ballot in November. This includes 37% who are very enthusiastic to do so and 36% who are somewhat enthusiastic about it. 15%, however, are not too enthusiastic to vote, and 12% are not enthusiastic at all.
Key points:
- Almost four in ten voters who support the president — 39% — have a high degree of enthusiasm. A similar proportion of Romney’s backers — 38% — express a similar degree of enthusiasm.
Voters Divide about Obama’s Job Performance
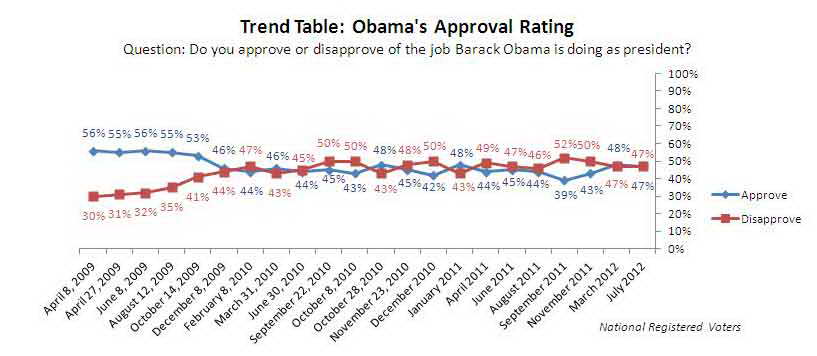
47% of registered voters approve of the job President Obama is doing in office. The same proportion — 47% — disapproves, and 6% are unsure.
Little has changed on this question since McClatchy-Marist last reported it in March. At that time, 48% applauded the president while 47% gave his job performance a thumbs-down. Five percent, at that time, were unsure.
Table: President Obama Approval Rating
Table: President Obama Approval Rating (Over Time)
Talking Favorability
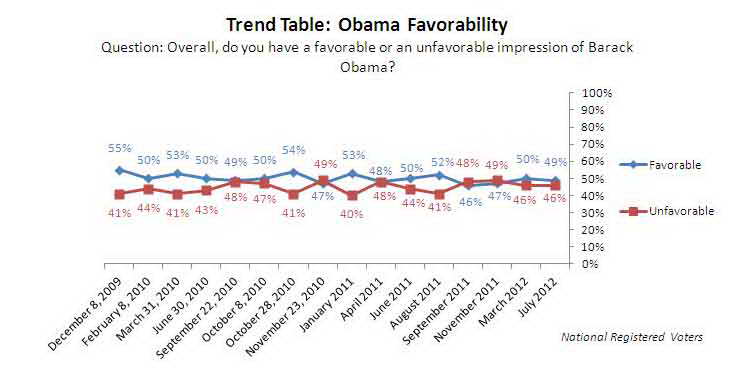
Looking at voters perceptions of the candidates, 49% of registered voters have a favorable view of President Obama. 46% have an unfavorable opinion of him, and 5% are unsure.
In March, half of voters — 50% — thought well of Mr. Obama while 46% did not. Three percent, then, were unsure.
Voters also divide about Romney. 46% have a favorable impression of him while 42% do not. 12% are unsure.
In McClatchy-Marist’s previous survey, 45% thought highly of Mr. Romney, and the same proportion — 45% — had a lesser opinion of him. 10%, at that time, were unsure.
Table: President Obama Favorability
Table: President Obama Favorability (Over Time)
Table: Mitt Romney Favorability
Obama, Romney Vie for Edge on Economy…Obama Tops on Foreign Policy
Which candidate do voters think will do a better job handling the economy? 46% report Obama is the better candidate for the job while 44% say Romney is. 11% are unsure.
However, Obama has the edge over Romney when it comes to foreign policy. 47% of registered voters nationally believe the president will do a better job handling this issue while 41% think Romney is better prepared to do so. 13% are unsure.
Table: Candidate Who Will Do a Better Job Handling the Economy
Table: Candidate Who Will Do a Better Job Handling Foreign Policy
Tax Cuts for All, Says Majority
President Obama wants to extend tax cuts for households earning less than $250,000 annually but not for income above that. However, a majority of registered voters — 52% — think the tax cuts should apply to all income levels. 43% say the tax cuts should pertain just to the middle class, households that make less than $250,000 a year. Five percent are unsure.
Key points:
- Six in ten Obama backers — 60% — believe the tax cuts should apply just to the middle class while 37% say they should extended regardless of income. 67% of Romney’s backers report the tax cuts should apply to all income while 27% say they should be given to households who earn less than $250,000 annually.
Table: Extension of Bush Era Tax Cuts
Talking Favorability


