January 24, 2012
1/24: Obama Leads Potential GOP Challengers by Wide Margins in NY
NY1/YNN/Marist New York State Poll
President Barack Obama will deliver his State of the Union address this evening. And, the good news for the president is the state of his electoral chances in New York is strong.
Click Here for Complete January 24th, 2012 NYS NY1/YNN-Marist Poll Release and Tables
The president leads his closest competitor, Mitt Romney, by 23 percentage points among registered voters statewide. Nearly six in ten — 58% — are for Obama while 35% support Romney, and 7% are undecided.
“New York ranks with the bluest of the blue states,” says Dr. Lee M. Miringoff, Director of The Marist College Institute for Public Opinion. “There’s nothing in the numbers to suggest it will be any different this election cycle.”
In a hypothetical contest between the president and Newt Gingrich, 63% favor Obama compared with 31% for Gingrich. Six percent are undecided.
When pitted against Rick Santorum, 61% of registered voters support Obama while 33% are for Santorum, and 6% are undecided. Against Ron Paul, the president has the support of 62% compared with 28% for Paul. Nine percent are undecided.
Table: 2012 Hypothetical Presidential Tossup: Obama/Romney
Table: 2012 Hypothetical Presidential Tossup: Obama/Gingrich
Table: 2012 Hypothetical Presidential Tossup: Obama/Santorum
Table: 2012 Hypothetical Presidential Tossup: Obama/Paul
Obama Approval Rating at 46% in NYS
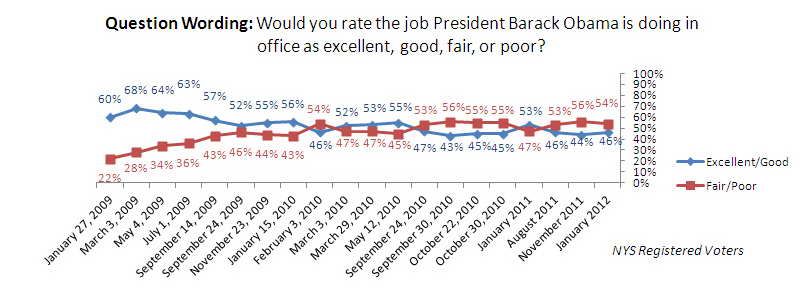
How do voters in New York State think the president is doing in office? 46% believe President Obama is doing either an excellent or good job. This includes 13% who say he is doing an excellent job and 33% who report he is doing a good one. 26% rate Obama’s performance as fair while 28% think he is doing poorly. Less than one percent is unsure.
In November, 44% gave the president high marks, 27% gave him a fair rating, and 29% said the president was performing poorly. Less than one percent, at the time, was unsure.
Table: Obama Approval Rating Over Time
Concrete Approval Rating for Schumer
A majority of registered voters in New York — 56% — thinks Senator Chuck Schumer is doing either an excellent or good job in office. Included here are 18% who report Schumer is doing an excellent job and 38% who think he is doing a good one. More than one in four — 27% — rate the senator’s performance as average while 12% think he is falling short. Five percent are unsure.
Schumer’s approval rating is unchanged since NY1/YNN-Marist’s November survey. At that time, 56% also gave Schumer a thumbs-up, 26% gave him fair grades, and 15% believed his performance was subpar. Three percent, then, were unsure.
Table: Schumer Approval Rating
Table: Schumer Approval Rating (Over Time)
38% Definitely Plan to Vote for Gillibrand
When it comes to the re-election chances of Senator Kirsten Gillibrand, fewer than four in ten registered voters in New York — 38% — say they definitely plan to cast their ballot for her. Nearly one in five — 18% — report they plan to vote against her. A notable 44% are unsure.
Similar proportions of voters had these views in November when 39% believed they would definitely support Gillibrand in her re-election bid, 22% said they would not, and 39% were unsure.
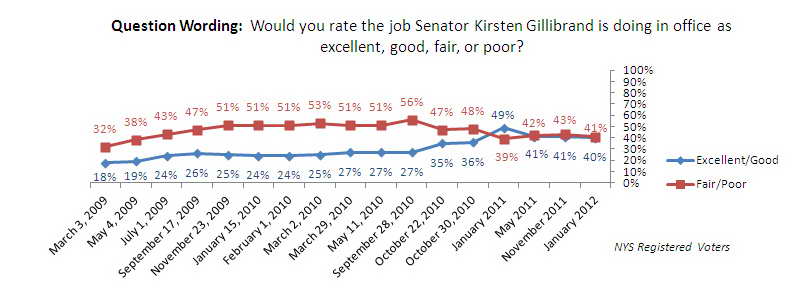
Gillibrand struggles to convince voters that she is doing well in office. 40% rate her performance as above average. This includes 6% who say she is excelling in her post and 34% who believe she is doing a good job. About three in ten — 29% — think Gillibrand’s job performance is fair while 12% say she is falling short, and 18% are unsure.
In November, 41% gave Gillibrand above average marks, 32% said she was doing a fair job while 11% reported she was doing poorly. 16%, at the time, were unsure.
Table: Definitely Plan to Vote For or Against Senator Kirsten Gillibrand in 2012
Table: Gillibrand Approval Rating


