November 4, 2013
11/4: De Blasio with BIG Lead over Lhota Going into Election Day
NBC 4 NY/WSJ/Marist New York City Poll
The clock is counting down to Election Day, and in this final NBC 4 New York/Wall Street Journal/Marist Poll, Democrat Bill de Blasio has a very wide lead over Republican Joe Lhota among New York City likely voters including those who are undecided yet leaning toward a candidate and those who voted by absentee ballot. De Blasio has the support of 65% of likely voters while Lhota receives 24%. Independence candidate Adolfo Carrion has 4% while 1% of likely voters citywide wants another candidate to be elected. Six percent are undecided.
 Click Here for Complete November 4, 2013 NBC 4 New York/Wall Street Journal/Marist Poll NYC Release and Tables
POLL MUST BE SOURCED: NBC 4 New York/Wall Street Journal/Marist Poll
“Bill de Blasio continues to be the overwhelming favorite with New York City voters while Joe Lhota can’t get any traction,” says Dr. Lee M. Miringoff, Director of The Marist College Institute for Public Opinion. “Even a Peyton Manning fourth quarter comeback wouldn’t be enough to close this large gap.”
When NBC 4 New York/Wall Street Journal/Marist reported this question last month, 67% of likely voters citywide supported de Blasio. 23% backed Lhota while Carrion had the support of 2%. One percent was for another candidate, and 7% were undecided.
By party:
- Among Democrats who are likely to vote, 79% are for de Blasio compared with 14% for Lhota and 2% for Carrion. In October, 82% backed de Blasio while 13% were for Lhota. One percent was behind Carrion.
- When it comes to likely Republican voters, 71% are for Lhota while 21% are for de Blasio. Three percent support Carrion. In that previous survey, 69% of likely Republican voters backed Lhota while 16% were for de Blasio, and 1% supported Carrion.
- Among non-enrolled voters who are likely to cast a ballot, 50% support de Blasio. 29% are for Lhota while 11% back Carrion. Last month, 58% of likely non-enrolled voters were for de Blasio compared with 21% for Lhota. Seven percent, at that time, backed Carrion.
Regardless of race, de Blasio receives, at least, majority support. Among African American voters who are likely to cast a ballot, 90% support de Blasio. Lhota and Carrion each receives 2%. 72% of Latino voters are for de Blasio while 10% are for Lhota, and 9% back Carrion. Among likely voters who are white, 53% support de Blasio, 39% back Lhota, and 2% are for Carrion.
Before last Wednesday’s debate, 65% of likely voters supported de Blasio while 24% were for Lhota. Carrion received the support of 4% while 1% wanted another candidate to be mayor. Six percent were undecided. After the debate, 65% supported de Blasio while 24% were for Lhota. Three percent backed Carrion while 1% were for another candidate. Seven percent were undecided.
“The debate season has come and gone,” says Dr. Lee M. Miringoff, Director of The Marist College Institute for Public Opinion. “But, the debates this fall have done more to reinforce voters’ impressions of the candidates than to change the character of the race.”
How strongly do likely voters citywide support their choice of candidate? 61% say they strongly support their selection for mayor while 30% are somewhat committed to their choice. Eight percent might vote differently, and 1% is unsure.
When NBC 4 New York/Wall Street Journal/Marist last reported this question, 54% said they were firmly committed to their choice of candidate. 36% reported they were somewhat behind their pick, and 9% said they might vote differently. Two percent were unsure.
65% of likely voters who support de Blasio say they will not waver in their commitment to him. This compares with 54% of likely voters who back Lhota and say they are strongly committed to him. Last month, 56% of de Blasio’s backers reported they strongly supported him while 49% of Lhota’s backers had a similar level of intensity.
Among registered voters including those who are undecided yet leaning toward a candidate and those who voted by absentee ballot, de Blasio — 63% — is ahead of Lhota — 21% — by 42 percentage points. Carrion receives the support of 5% while 1% wants someone else to be elected. Nine percent are undecided.
Table: 2013 Race for New York City Mayor (NYC Likely Voters with Leaners and Absentee Voters)
Table: 2013 Race for New York City Mayor (NYC Registered Voters with Leaners and Absentee Voters)
Done Deal for de Blasio?
Most registered voters in New York City think, regardless of who they plan to support, de Blasio will defeat Lhota tomorrow. 83% of voters believe de Blasio will win while only 8% think Lhota will be victorious. Nine percent are undecided. Even an overwhelming proportion of Lhota’s backers — 81% — think de Blasio will be the city’s next mayor.
Table: Who Do You Think Will Win the Election for New York City Mayor? (NYC Registered Voters)
About Two-Thirds Perceive de Blasio Favorably… Upside Down Rating for Lhota
64% of registered voters in New York City have a favorable opinion of de Blasio. 26% have an unfavorable one, and 10% have either never heard of him or are unsure how to rate him. In October, similar proportions shared these views. 65% of registered voters thought well of de Blasio. 23% had an unfavorable impression of him, and 12%, at that time, had either never heard of de Blasio or were unsure how to rate him.
When it comes to Lhota, 47% have an unfavorable view of him. 32% have a favorable one, and 21% have either never heard of him or are unsure how to rate him. When NBC 4 New York/Wall Street Journal/Marist last reported this question, 43% of registered voters had an unfavorable opinion of Lhota while 32% had a favorable one. 25% had either never heard of him or were unsure how to rate him.
Table: Bill de Blasio Favorability (NYC Registered Voters)
Table: Joe Lhota Favorability (NYC Registered Voters)
De Blasio Trumps Lhota on the Issues
About two-thirds of registered voters — 66% — think de Blasio is the candidate who is better able to make the city more affordable for the average family. 18%, however, say Lhota is the candidate who will improve affordability in the city. 15% are unsure. Last month, 67% of registered voters thought de Blasio was more capable to make the city affordable. 19% had this impression of Lhota, and 14%, at that time, were unsure.
Looking at crime in the city, 48% of registered voters believe de Blasio is more likely to keep crime down while 32% think Lhota is better able to keep the city safe. About one in five — 19% — is unsure. In NBC 4 New York/Wall Street Journal/Marist’s previous survey, 52% said de Blasio would make the city safer. 31% believed Lhota was better able to keep crime down, and 17% were unsure.
Table: NYC Mayoral Candidate who is More Likely to Keep Crime Down (NYC Registered Voters)
Ideologically Speaking
What are voters’ impressions of de Blasio’s political ideology? A majority of registered voters — 56% — thinks his ideology is about right. 29% say he is too liberal while 4% say he is too conservative. 11% are unsure. In October, 59% thought de Blasio’s ideology was in line. 24% reported he was too liberal while 3% said he was too conservative. 14% were unsure.
When it comes to Lhota’s political ideology, 34% say his ideology is about right. 35% believe Lhota is too conservative while 8% say Lhota is too liberal. 23% are unsure. Last month, 35% of registered voters reported Lhota’s ideology was about right. 31% said he was too conservative while only 8% believed he was too liberal. 26%, then, were unsure.
Table: Bill de Blasio’s Ideology (NYC Registered Voters)
Table: Joe Lhota’s Ideology (NYC Registered Voters)
Time for Change, Say More than Six in Ten
64% of registered voters want the next mayor to move the city in a different direction while 31% want him to continue Mayor Michael Bloomberg’s policies. Six percent are unsure. There has been little change since NBC 4 New York/Wall Street Journal/Marist’s October survey. At that time, 66% wanted a departure from Bloomberg’s policies. 29% reported they thought the city’s current policies should be continued, and 6% were unsure.
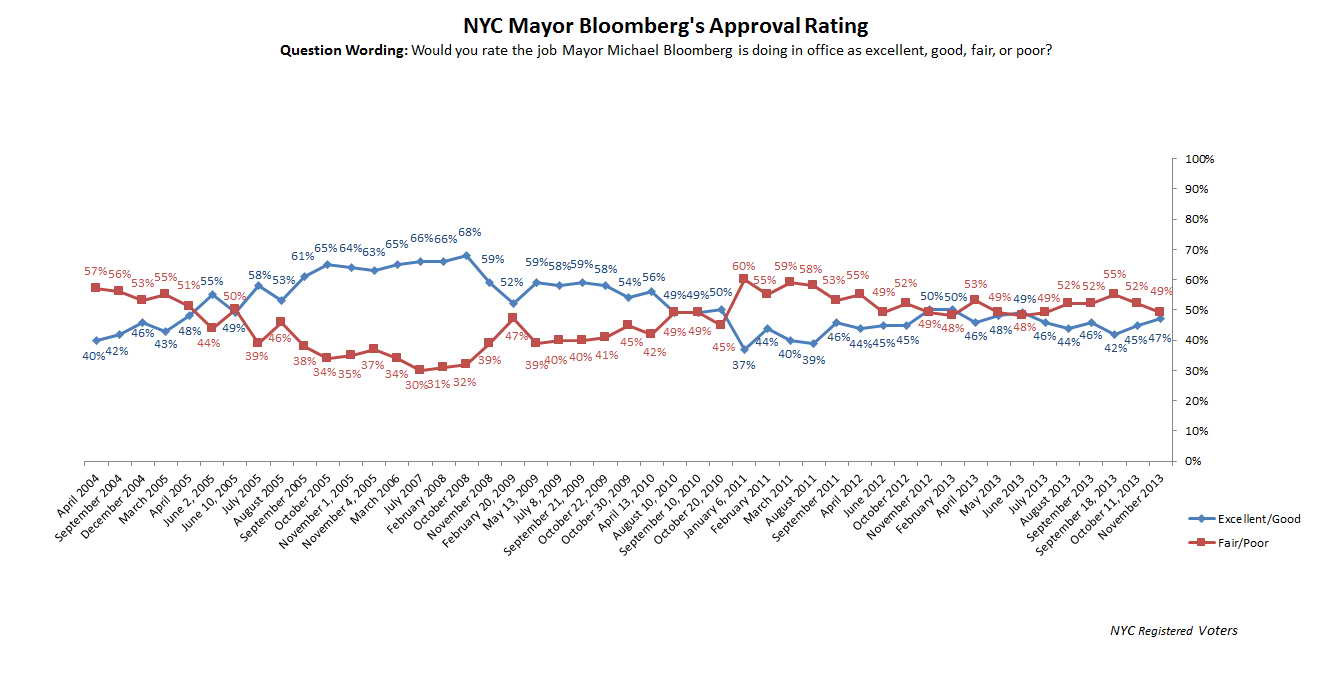
So, how do voters think Bloomberg is doing in office? 47% say he is doing either an excellent or good job in office. This includes 13% who believe he is doing an excellent job and 34% who think he is doing a good one. 29% rate Bloomberg’s approval rating as fair while 20% report he is performing poorly. Three percent are unsure.
Last month, 45% gave Bloomberg high marks. 34% said he was doing a fair job while 18% thought Bloomberg’s job performance was subpar. Two percent were unsure.
Table: Bloomberg Approval Rating (NYC Registered Voters)
Table: Bloomberg Approval Rating Over Time (NYC Registered Voters)
The City’s Course
49% of registered voters think New York City is moving in the right direction while 42% believe it is moving in the wrong one. Nine percent are unsure. When NBC 4 New York/Wall Street Journal/Marist last reported this question, 46% of voters thought the city was traveling on the right road while 46% said it needed a new path. Eight percent were unsure.
Table: New York City Direction (NYC Registered Voters)
Table: New York City Direction Over Time (NYC Registered Voters)


