November 18, 2011
11/18: Voters Pessimistic About Super Committee Deal
McClatchy/Marist National Poll
With the deadline nearing for Congressional Republicans and Democrats on the Super Committee to reach an agreement on how to reduce the federal budget deficit, most voters nationally are not confident that a deal will be reached.
Click Here for Complete Friday, November 18, 2011 USA McClatchy-Marist Poll Release and Tables
According to this national McClatchy-Marist Poll, 85% of registered voters are not very confident or not confident at all that an agreement will be reached. 13% express some degree of confidence, and 2% are unsure.
“Congress may ultimately act in the eleventh hour, but the clock is ticking,” says Dr. Lee M. Miringoff, Director of The Marist College Institute for Public Opinion. “Voters have even less confidence in the Super Committee than they have in Congress as a whole.”
By party:
- Regardless of party, confidence is lacking. 88% of independent voters, 84% of Republicans, and 82% of Democratic voters are not confident an agreement will be reached.
On the specifics of the Super Committee’s proposal:
- More than eight in ten registered voters — 81% — say major cuts to Social Security and Medicare should not be included in the deficit reduction proposal while 17% report they should be, and 2% are unsure.
- 59% of registered voters do not think tax increases on businesses should be included in the plan while 35% disagree, and 6% are unsure. Here, there are partisan differences. Although 71% of Republican voters and 63% of independent voters don’t want these inclusions, Democrats divide. 45% of Democrats want tax increases to be part of the proposal while the same proportion — 45% — does not.
- Looking at major cuts in defense spending, a slim majority — 51% — doesn’t think these should be part of the deficit reduction proposal. 45% think they should be, and 4% are unsure. By party, 68% of Republicans and 54% of independent voters do not want to see these cuts rolled into the plan. More than six in ten Democrats — 62% — would like them to be included.
- However, about two-thirds of voters — 67% — want tax increases on higher-income Americans to be in the proposal while three in ten — 30% — do not. Three percent are unsure. By party, 83% of Democrats, 64% of independents, and 53% of Republicans believe increased taxes on higher-income Americans should be part of the proposal to reduce the deficit.
Who will voters blame if an agreement is not reached? There is enough blame to go around. 39% will point a finger at Congressional Republicans, 27% will blame Congressional Democrats, and 23% will hold both groups accountable. Two percent won’t blame either, and 8% are unsure.
Table: Confidence in Super Committee to Reach Deficit Reduction Agreement
Table: Deficit Reduction Agreement: Cuts to Social Security and Medicare?
Table: Deficit Reduction Agreement: Increases in Taxes on Businesses?
Table: Deficit Reduction Agreement: Major Cuts in Defense Spending?
Table: Deficit Reduction Agreement: Increases in Taxes on Higher-Income Americans?
Table: Group Responsible if Deficit Reduction Agreement is Not Reached
Tax the Wealthiest Americans, Say More than Six in Ten
Nearly half of voters — 49% — support a so-called “millionaire’s tax” for individuals earning $200,000 or more and $250,000 or more for married couples. 43% oppose it, and 8% are unsure.
However, more voters — 61% — support a similar surcharge on Americans earning more than $1 million while 33% oppose such a federal surcharge, and 6% are unsure.
By party:
- 66% of Democrats and 51% of independent voters back such a tax on those earning at least $200,000. Republicans disagree with 64% against the proposed surcharge.
- 77% of Democrats and 62% of independent voters back a federal surcharge on income of $1 million or more while a slim majority of Republicans — 51% — oppose such a tax.
Table: Support or Oppose “Millionaire’s Tax” on Those Earning At Least $200,000
Table: Support or Oppose “Millionaire’s Tax” on Those Earning $1 Million
Voters’ Take on a Flat Tax
The concept of a flat tax, a system which applies one tax rate to all income levels, has been much talked about lately. What are voters’ views about such a tax? When it comes to the effect on the wealthy, 38% say it will lower the taxes of those in this income group. 36% believe it will raise the amount of taxes the wealthy pay while 21% think this group will pay the same amount of taxes. Five percent are unsure.
When it comes to the middle class, a plurality of voters — 43% — say a flat tax would result in the middle class paying about the same amount of taxes as they currently do. 37% report the middle class will shell out more tax dollars while 14% think the result will be lower taxes on the middle class, and 6% are unsure.
Looking at the impact on the poor, a majority of registered voters — 52% — say a flat tax rate would mean higher taxes for this group. One in four — 25% — report the poor will pay the same amount of taxes while 18% think a flat tax will lower the taxes of the poor. Five percent are unsure.
Many voters do not think the poor should be exempt from paying taxes. Six in ten — 60% — believe this group should be taxed on what they earn while 37% say the poor should be exempt from paying taxes. Three percent are unsure.
Key points:
- Nearly half of Democratic voters — 49% — think a flat tax rate will lower taxes for the wealthy while 45% of Republicans and 40% of independent voters say it will raise taxes for this group.
- Looking at the middle class, 46% of Democrats believe a flat tax will increase taxes for this group while 46% of Republicans and 43% of independents think the middle class will pay the same amount of taxes.
- Majorities of Democrats — 57% — and independent voters — 51% — and nearly half of Republicans — 48% — think a flat tax will raise taxes on the poor.
- On the overall issue of taxing the poor, 71% of Republicans and 62% of independent voters report the poor should pay taxes on what they earn. However, Democrats divide. A slim majority — 51% — say the poor should be exempt from taxes while 47% think the poor should pay taxes on what they earn.
Table: Impact of Flat Tax on the Wealthy
Table: Impact of Flat Tax on the Middle Class
Table: Impact of Flat Tax on the Poor
Lowest Approval Ratings for Congressional Republicans and Democrats
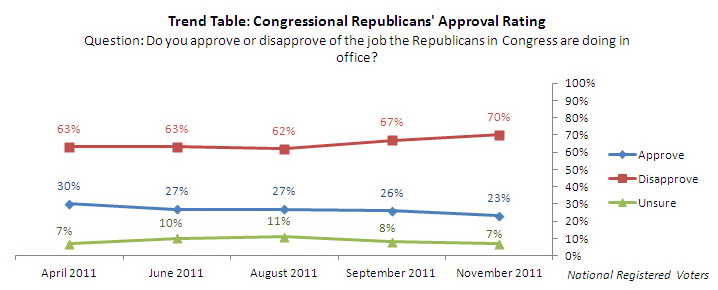
There’s bad news for the Republicans and Democrats in Congress. Only 23% of voters approve of the job the Republicans in Congress are doing in office while 70% disapprove, and 7% are unsure. This is the lowest approval rating achieved by Congressional Republicans.
In September, 26% gave them good marks compared with 67% who disapproved and 8% who were unsure.
Key points:
- Half of Republican voters — 50% — and 54% of Tea Party supporters disapprove of the job Congressional Republicans are doing.
It’s a similar story for Congressional Democrats who have also reached an all-time low. 28% of voters approve of the job they are doing in office while 65% disapprove, and 7% are unsure. In McClatchy-Marist’s September survey, 30% thought Congressional Democrats were doing well while 63% disapproved, and 7% were unsure.
Key points:
- 58% of Democrats approve of the job Congressional Democrats are doing in office.
Table: Congressional Republicans’ Approval Rating
Table: Congressional Republicans’ Approval Rating (Over Time)
Table: Congressional Democrats’ Approval Rating


