In Presidential elections some people will always vote for the Democrat and some will always vote for the Republican. But, there’s that group of people in the middle who make up their mind as the campaign moves toward Election Day that often decides who wins. The exact proportion of undecided voters varies from campaign to campaign—sometimes voters have a more difficult time deciding who to vote for and as much as 10 to 15% of likely voters are undecided. But in some years, like 2012, voters pick sides early and there are few undecided voters left by Labor Day, the start of the fall campaign. This election season, polls have consistently shown few undecided likely voters. So, who are these people? How much do they matter? If they do vote, in whose direction will they break?
In order to look at these questions, the data from the NBC News/Wall Street Journal/Marist battleground state polls of Florida, Virginia, and Ohio were combined. This dataset comprises three polls from each state in September and October, two before the debates started and one after, for a total of 9 polls. The combined samples include 11,510 registered voters, of which 1,168–approximately 10%–indicated that they were unsure of their vote preference. About 40% of these respondents chose a side in the follow-up question that asked if they were leaning toward a candidate, but the majority said they were still not sure.
Will the undecideds vote? Perhaps, the single biggest question is whether these people will vote. The answer could hold the key to who wins the election. Undoubtedly, some will stay home. However, of the 1,168 undecided voters in the polls, 61% of them are classified as likely voters. The Marist Poll likely voter model takes into account chance of vote, interest in the election, past voting behavior, and turnout expectations. These undecided voters likely to cast a ballot will probably make a decision at some point, or even at the last minute, and vote. They account for 8% of all likely voters in nine battleground states and could make a difference in the race.[1] In this close race, that is a substantial voting bloc.
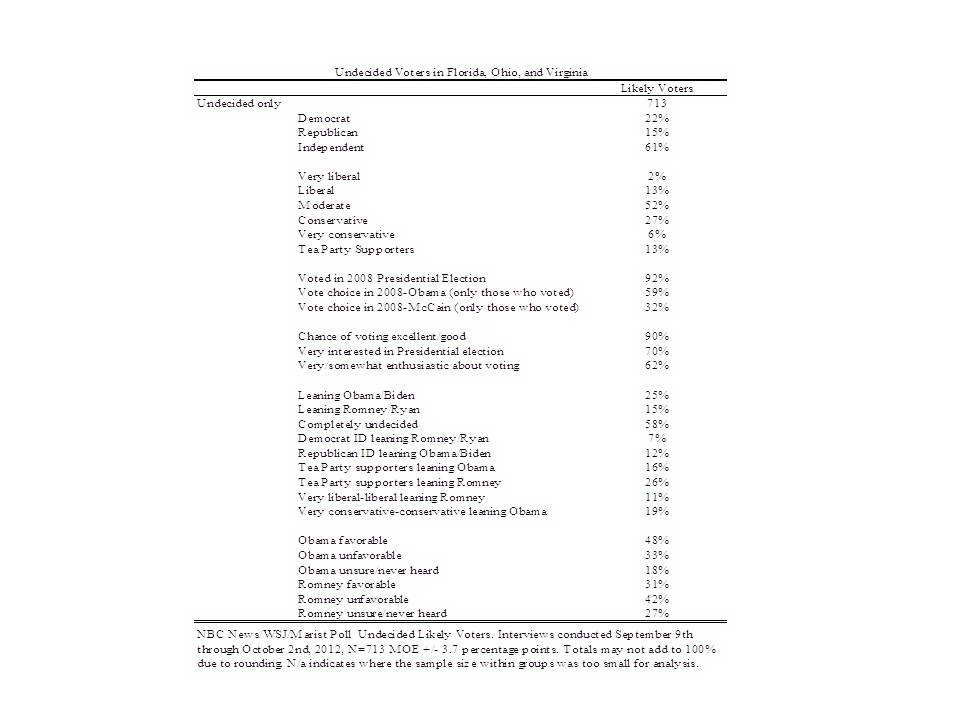
Beyond the likely voter classification, there are other factors that point to a substantial number of undecided voters actually casting a ballot. Perhaps, most strikingly, is that 92% of undecided likely voters report having participated in past presidential elections, and 90% say their chance of voting this year is either excellent or good. Sixty-two percent of undecided likely voters also say they are very or somewhat enthusiastic about voting. Over two-thirds—70%– indicate they are very interested in the campaign. These numbers suggest undecided likely voters are not apathetic, uninformed or uninterested. They are genuinely interested in voting—they simply have not decided who to vote for yet.
Who are these undecided voters? This group of voters is not demographically exceptional. Fifty-four percent are women, 52% are married, and 39% are college graduates. Thirteen percent are between the ages of 18 and 29, 26% are between ages 30 and 44, 29% are in the 45-49 age range, and just about a third are over 60. Seventy-six percent identify as white, 10% are African American, and 9% are Latino.
Politically, most of these people are often not committed to a party or ideology. Twenty-two percent identify as Democrats, compared to 15% that identify as Republicans. The largest group, 61%, identify as independents. The same pattern is evident with ideology: 33% are either conservative or very conservative, compared with only 15% who are liberal or very liberal, and the remaining 52% are moderates. Thirteen percent say they support the Tea Party.
Why are they undecided? If these people are engaged, enthusiastic, or, most importantly, likely to vote, why have they not made a decision yet? It is often assumed people who have not decided who to vote for are not paying attention or do not care. The data offer some insights. Of the 92% of current undecided likely voters who voted in the previous presidential election, 59% of them recall voting for President Obama, while only 32% recall voting for Senator McCain. The remainder either thinks they voted for another candidate or cannot recall. But, they divide about Obama’s job approval. Thirty-six percent approve of the job he is doing as President and 36% disapprove. The remaining 28% are unsure. Additionally, 53% think the nation is headed in the wrong direction, and only 33% say it is headed in the right one.
Altogether, these results indicate that most of these undecided likely voters are conservatives or moderates, who are dissatisfied with Obama’s presidency and the state of the nation. But, these individuals are not fond of Romney either. Romney’s favorability rating is upside-down among this group. Only 31% give him a favorable rating and 42% rate him unfavorably. Even among Republicans in this undecided likely voter group, Romney has only a 39% favorability rating and a 32% unfavorable one.
Who will they vote for? As noted, about 40% of undecided voters provided an answer when asked if they lean toward one candidate or another. Although the majority of undecided likely voters still say they do not know, 25% state they lean toward Obama, and 15% lean toward Romney. A handful of undecided partisans lean toward the candidate across the aisle: 7% of undecided Democrats lean toward the Republican ticket, and 12% of undecided Republicans lean toward the Democratic ticket. Interestingly, 16% of those who identify as Tea Party supporters lean toward Obama, and 26% lean toward Romney. The favorability ratings advantage Obama. Among undecided likely voters, Obama nets a plus 15 points compared with Romney’s net 11 points in a negative direction. Still, 58% remain undecided even when asked if they are leaning toward a candidate. For them, it is anyone’s guess.
As we approach the final few days of the campaigns, the proportion of undecided likely voters has continued to shrink. Some might have already voted and made their decision, but many of these individuals will not choose until they get into the voting booth on Election Day—if they choose to vote. The numbers indicate that a good proportion of undecided registered voters are likely to vote. The campaigns have many competing goals and issues to address, but one of the most crucial remains attracting undecided voters, even in a year in which there are few undecideds left. The close race means these few undecided voters could make the difference.
[1] The Marist Poll releases tables which show a smaller percentage of undecided registered and likely voters. These tables do not categorize undecided voters who are leaning toward a candidate as undecided but instead include them within the candidate’s numbers. For this analysis, undecided voters include voters who may be leaning toward a candidate.


