October 28, 2010
10/28: Turnout Key for Midterm Elections
While Democrats have the edge among registered voters nationwide heading into next week’s midterm elections for Congress, Republicans have the advantage among those who are most likely to vote.
Click Here for Complete October 28, 2010 USA McClatchy-Marist Poll Release and Tables
According to this McClatchy-Marist Poll, 47% of registered voters nationwide report they are more likely to vote for a Democrat in their district while 41% say they are more likely to support a Republican. Six percent do not plan to vote for either party’s candidate, and 6% are undecided.
When looking at likely voters nationally, neither party has the competitive edge. Among this group of voters, 46% say they are more likely to vote for a Democrat while 46% report they are more likely to support a Republican candidate. Four percent will not vote for either party’s candidate, and the same proportion — 4% — are undecided.
However, Republicans gain the advantage among voters who are the most likely to go to the polls on Election Day. Here, 49% report they are more likely to vote for a Republican candidate while 43% say they are more likely to support a Democrat. Three percent believe they will not vote for either party’s candidate, and 4% are undecided.
“With numbers like these, it’s no wonder both parties are putting the pedal to the floor to get their supporters out,” says Dr. Lee M. Miringoff, Director of The Marist College Institute for Public Opinion. “What location is to real estate, turnout is to this year’s political landscape.”
Table: Generic Congressional Ballot
Democrats Narrow Enthusiasm Gap
Four in ten registered voters nationally — 40% — report they are very enthusiastic about voting in next Tuesday’s elections. In McClatchy-Marist’s October 8th survey, 36% reported a similar level of enthusiasm.
Republican voters continue to be more energized than Democrats about casting their ballot on Election Day, but Democrats have narrowed the enthusiasm divide. Currently, 49% of Republicans compared with 35% of Democrats express a high level enthusiasm, a 14 percentage point difference. In McClatchy-Marist’s previous poll, that difference stood at 23 percentage points. At that time, a majority of Republicans — 51% — said they were very enthusiastic about voting on Election Day compared with 28% of Democrats. There has also been a bump in the proportion of independent voters who are very enthusiastic. 38% feel this way now compared with 32% a few weeks ago.
Age and gender gaps remain on this question. The youngest members of the electorate — those 18 to 29 — are underwhelmed by the upcoming elections. Only 13% report they are very enthusiastic about voting compared with 11% earlier this month. The eldest members of the electorate — those 60 or older — outpace their youngest counterparts on enthusiasm by nearly four-to-one. Half of those over 60 — 50% — now report a high level of enthusiasm. 48% had a similar degree of enthusiasm in McClatchy-Marist’s early October survey.
Looking at gender, 44% of male voters and 37% of female voters say they are very excited about voting on Election Day. 39% and 32%, respectively, reported the same earlier this month.
Obama Approval Rating Inches Upward
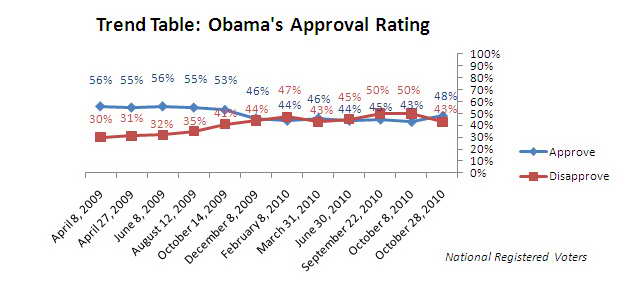
President Barack Obama has a slight increase in his job approval rating. 48% of registered voters nationally say they approve of his job performance, 43% disapprove, and 9% are unsure. In a McClatchy-Marist survey earlier this month, 43% approved, half disapproved, and 7% were unsure.
Democrats and independents are responsible for this uptick in the president’s rating. 79% of Democrats currently say they approve of the president’s job performance compared with 74% earlier this month. Nearly half of independents — 48% — share this positive opinion of Mr. Obama’s performance. This is a 13 percentage point increase since McClatchy-Marist’s last national survey when 35% held this view. Among Republican voters, 14% approve of the president’s job performance while 12% did so earlier in October.
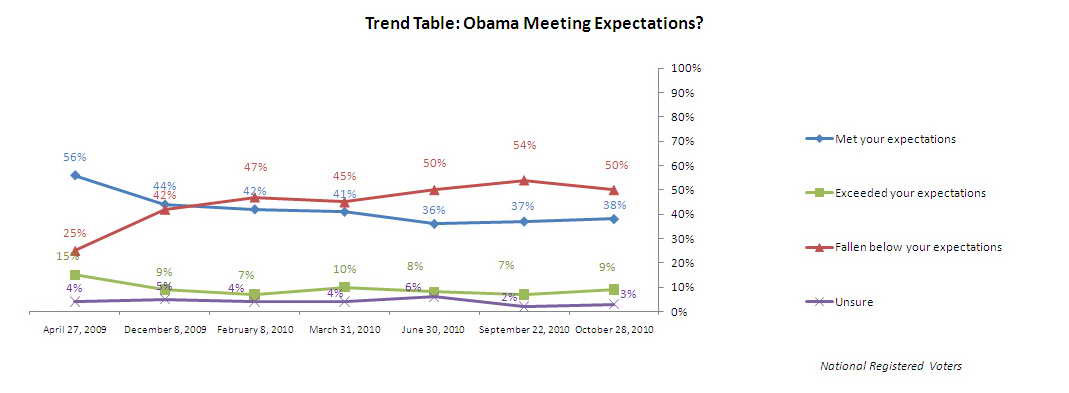
One wrinkle for Obama, though, is that half of voters still say he has fallen below their expectations as president. In McClatchy-Marist’s September 22nd survey, 54% said the same.
Table: Obama Approval Rating
Table: Obama Approval Rating Over Time
Table: Obama Meeting Expectations
Table: Obama Meeting Expectations Over Time
Economic Conditions Still Viewed as Inherited
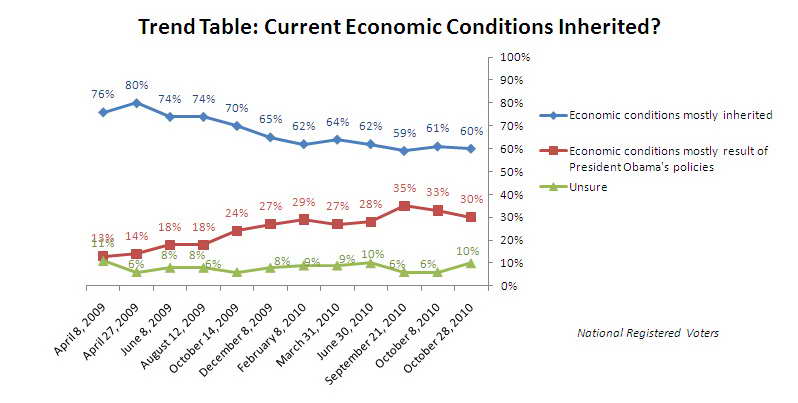
Six in ten registered voters — 60% — believe President Obama mostly inherited today’s economic conditions from the Bush years. These perceptions are bolstered by 85% of Democrats and 61% of independents who share this view. 30% of registered voters report the nation’s economic conditions are a result of the president’s own policies, including 59% of Republicans.
Table: Economic Conditions Inherited
Table: Economic Conditions Inherited Over Time
Americans Divide Over Future of the U.S. Economy
When thinking about the future of the U.S. economy, registered voters divide. 47% are more optimistic and say the worst is behind us, 45% are more pessimistic and think the economy will get worse, and 8% are unsure. A few weeks ago, 49% said there is bad economic news on the horizon, 46% said better days are ahead, and 5% were unsure.
Among likely voters nationally, 48% report the worst is behind us, 44% say the worst is yet to come, and 9% are unsure.
Looking at Americans overall, when thinking about the future of the U.S. economy, 47% believe the worst is yet to come while 45% say the worst is behind us. 8% are unsure. In McClatchy-Marist’s previous survey, half — 50% — thought the worst was yet to come, 46% said it was behind us, and 4% were unsure.
Table: U.S. Economy — Will It Get Worse?
Obama Viewed Favorably by Majority
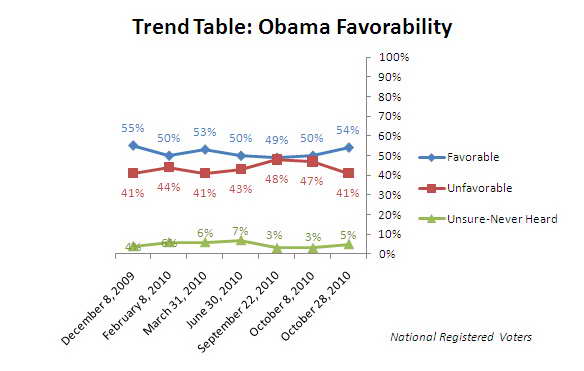
A majority of registered voters — 54% — have a favorable impression of President Barack Obama while 41% have an unfavorable one. 5% are unsure. In McClatchy-Marist’s early October survey, half — 50% — thought highly of the president, 47% did not, and 3% were unsure.
Table: Obama Favorability
Table: Obama Favorability Over Time
Nearly Half Plan to Support Incumbent
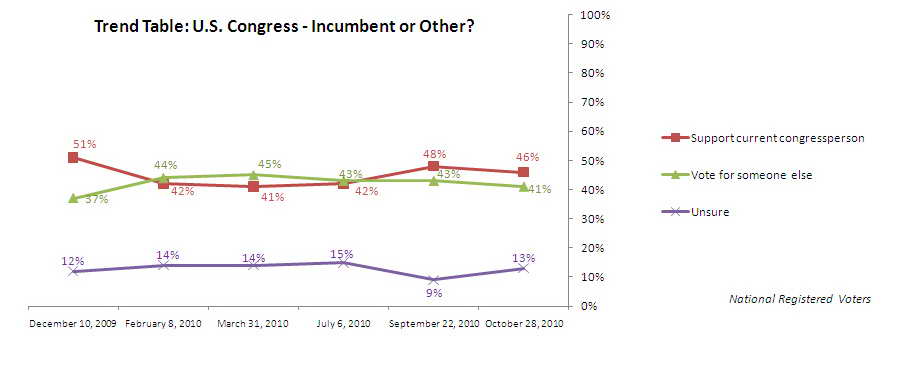
46% of registered voters report they will support their current elected congressperson on Election Day while 41% believe they will vote for someone else. 13% are undecided. In McClatchy-Marist’s September 22nd survey, 48% said they would support the incumbent, 43% wanted someone else, and 9% were undecided.
A majority of Republicans — 54% — say they want someone new in office while 38% say they want to stick with their current elected official. Just 8% are undecided. In contrast, a majority of Democrats — 54% — report they plan to support their incumbent. 26% think they will vote for someone else, and 20% are undecided. Independent voters divide with 46% saying they want their incumbent to remain and 44% reporting they want someone else to be elected. 10% are undecided.
Table: U.S. Congress — Incumbent or Other?
Table: U.S. Congress — Incumbent or Other? (Over Time)
Majority of Americans View Nation as On the Wrong Path
52% of U.S. residents think the nation is moving in the wrong direction while 38% believe it is moving along the right path. 10% are unsure. In McClatchy-Marist’s September 22nd survey, 56% thought the country needed a new compass, 41% said the nation was on track, and 3% were unsure.

